TPU Building - Corner Cut#
1. Project Description#
The objective of this project is to reproduce the wind pressure properties over the Tokyo Polytechnic University (TPU) Building - Corner Cut, as measured in wind tunnel by [1]. The building is at resolution level “lvl5” of the digital wind tunnel. One convective time scale is defined as \(CTS = B / U_H\).
Source of target results:
List of analysed cases |
||||
|---|---|---|---|---|
Wind direction |
0° |
15° |
30° |
45° |
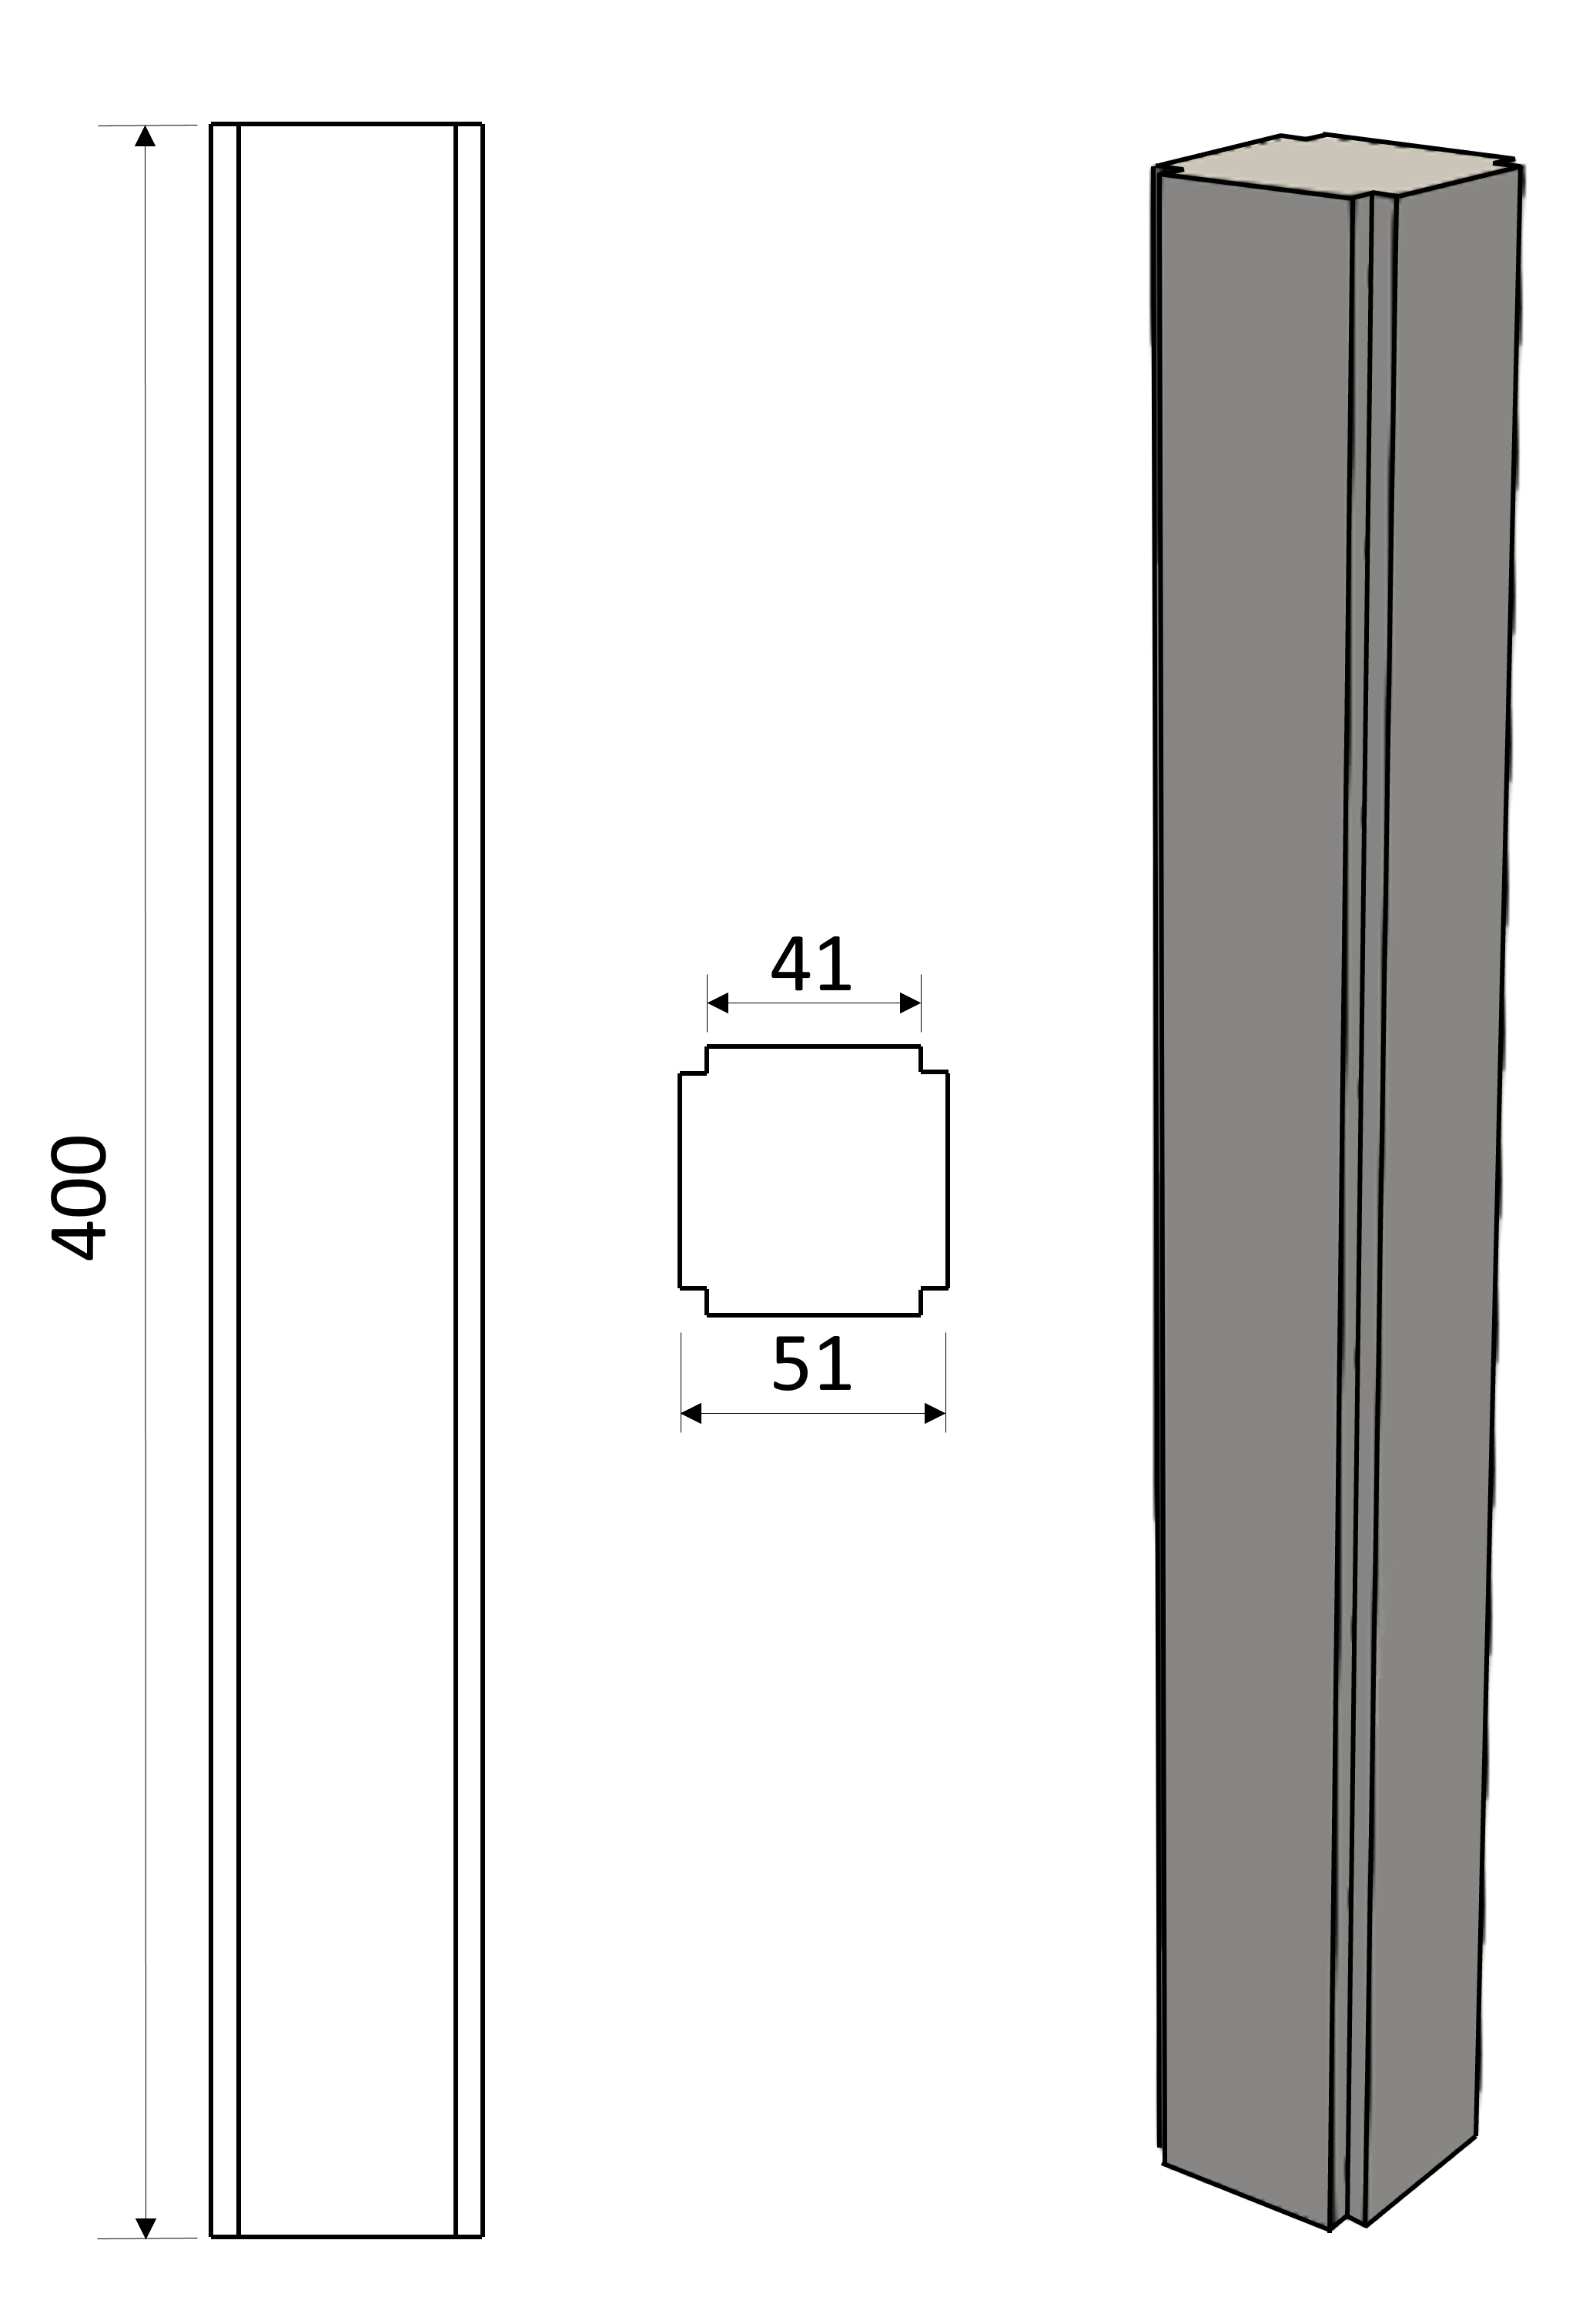
Ilustration of the geometry.#
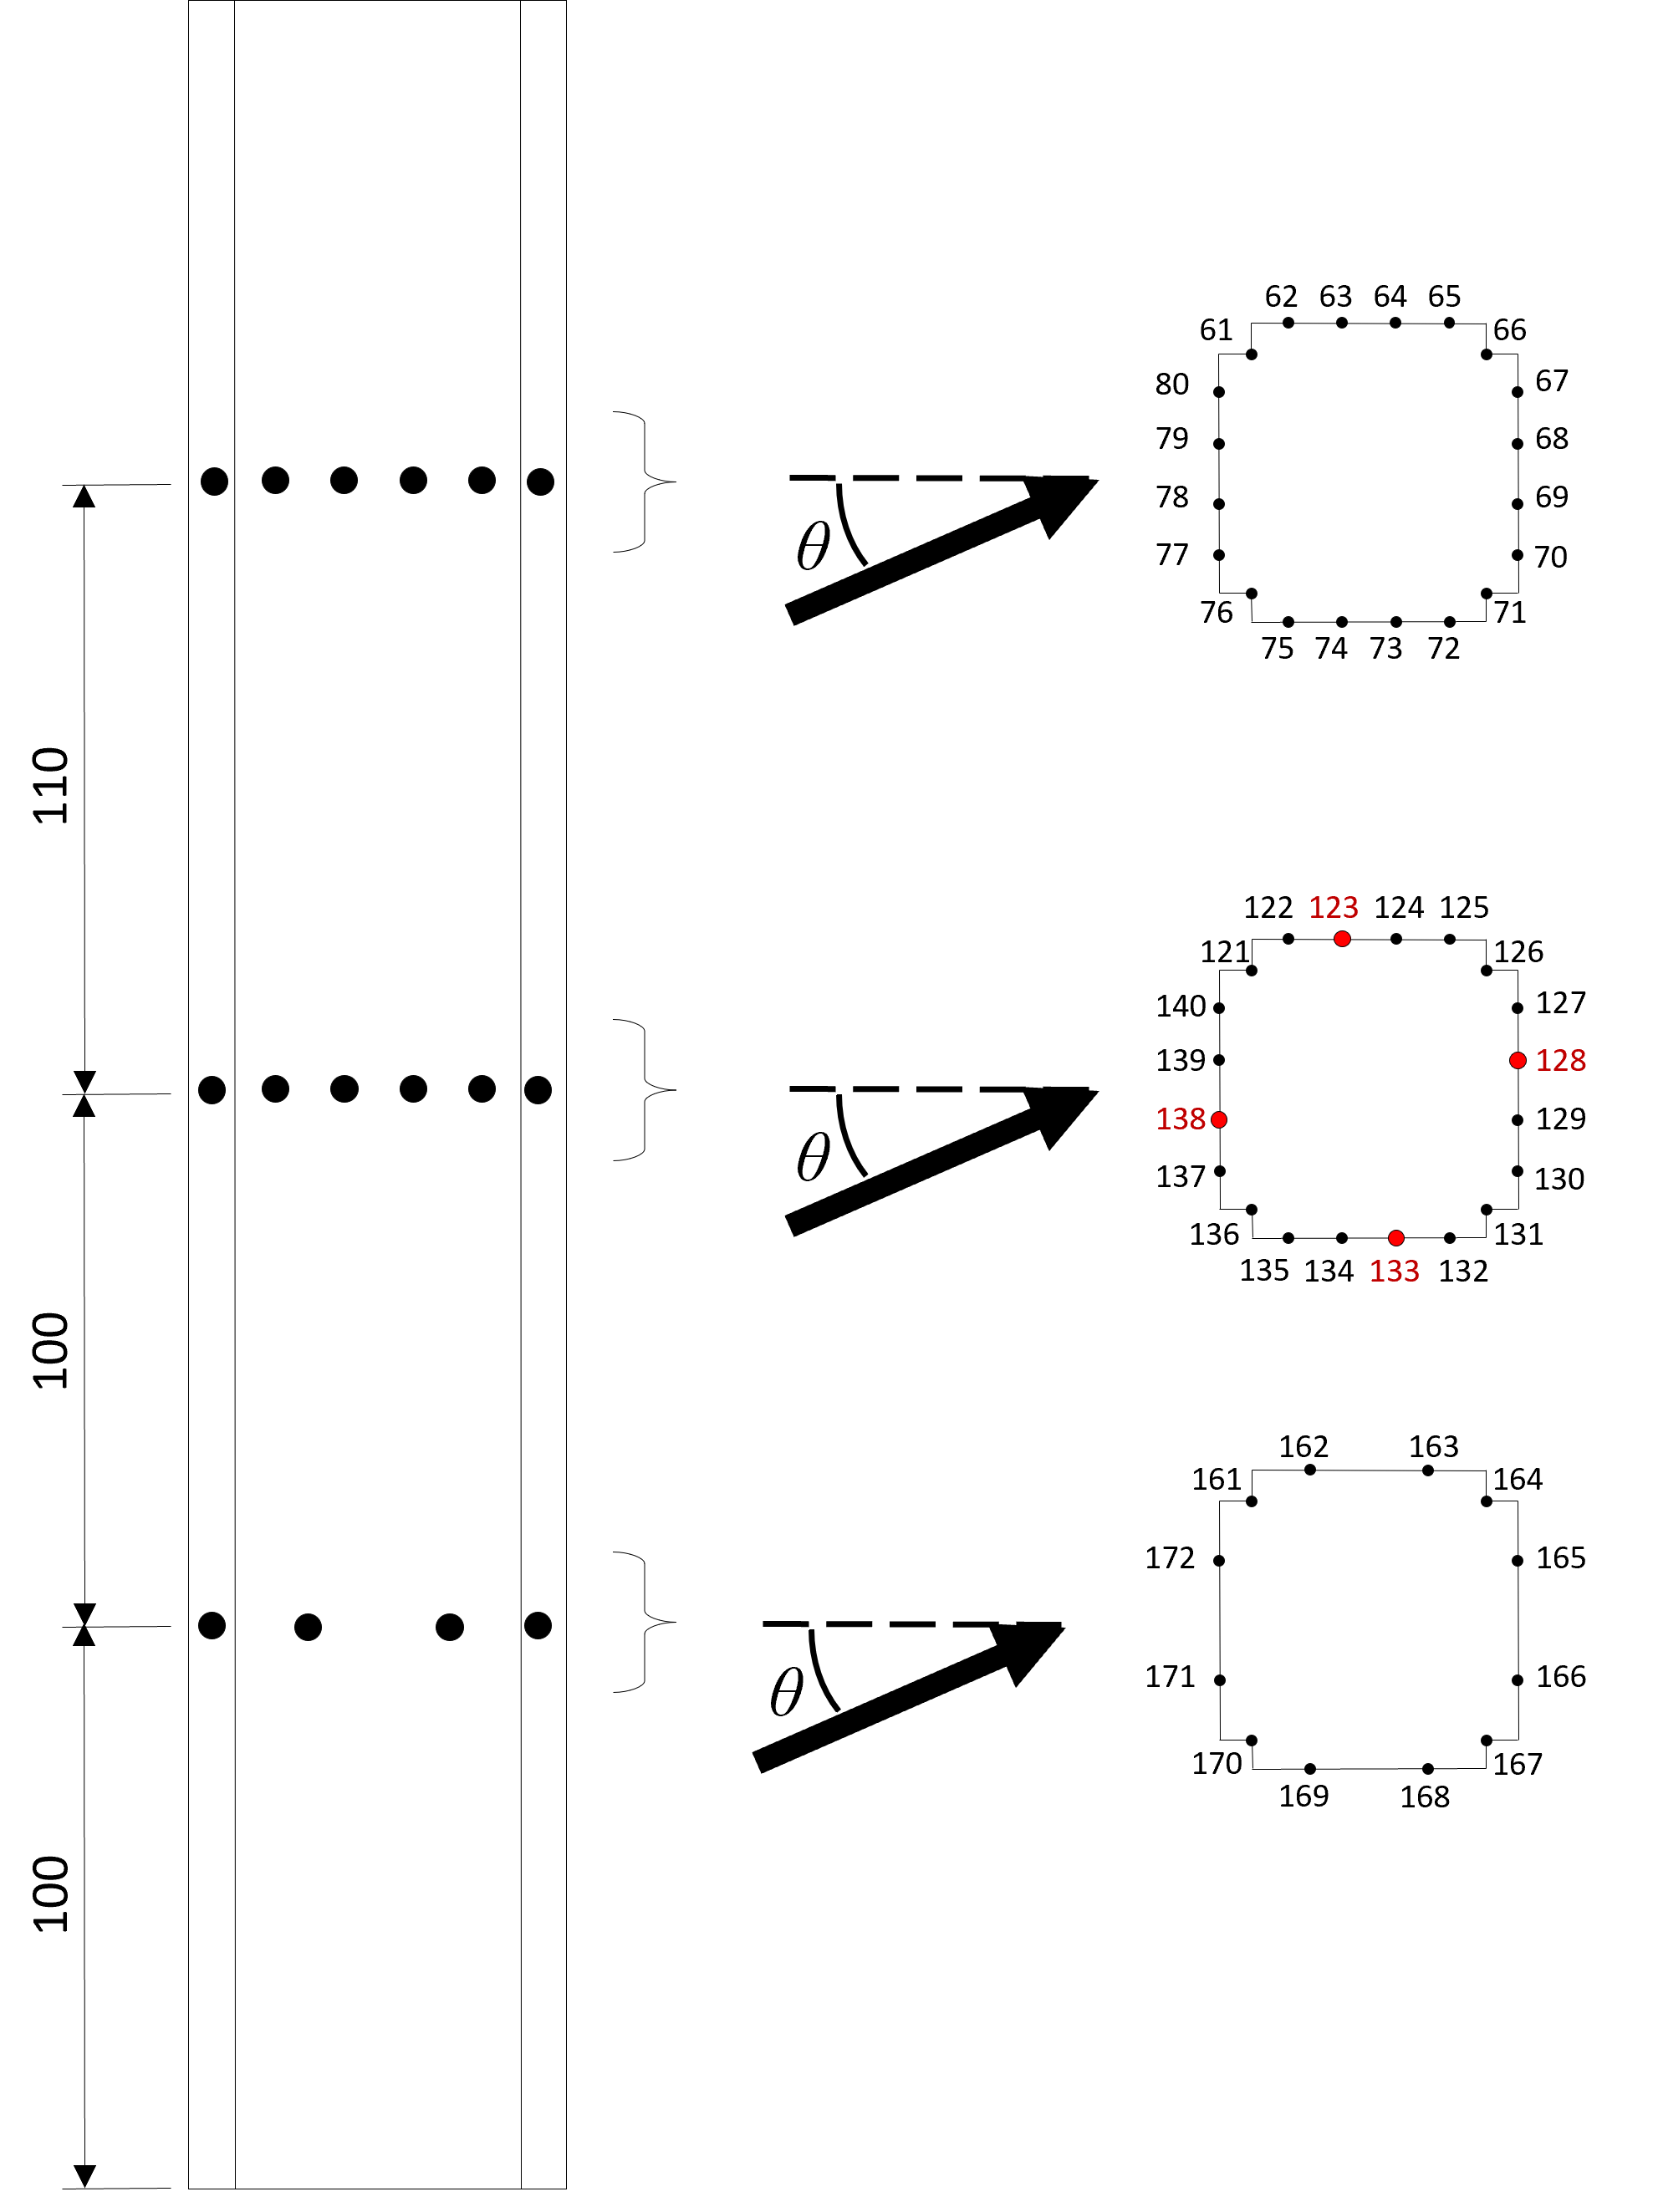
Ilustration of the probes location and wind directions.#
2. Simulation Setup#

Ilustration of the computational domain.#
Simulation parameters (same for all cases) |
|
|---|---|
\(\Delta x / B\) (spatial resolution) |
1.00E-2 |
\(\Delta t / CTS\) (temporal resolution) |
7.08E-4 |
\(\text{exports} / CTS\) (pressure acquisition frequency) |
1.13E-1 |
\(T / CTS\) (statistical sample size) |
7.93E+2 |
\(Re_B = U_H B / \nu\) |
2.04E+5 |
Computational performance (NVIDIA RTX A5500) |
||||
|---|---|---|---|---|
Case |
0° |
15° |
30° |
45° |
Node count (million) |
102 |
103 |
105 |
105 |
Allocated memory (Gb) |
16 |
16 |
16 |
16 |
Elapsed time (h) |
27 |
26 |
30 |
30 |
3. Inflow#
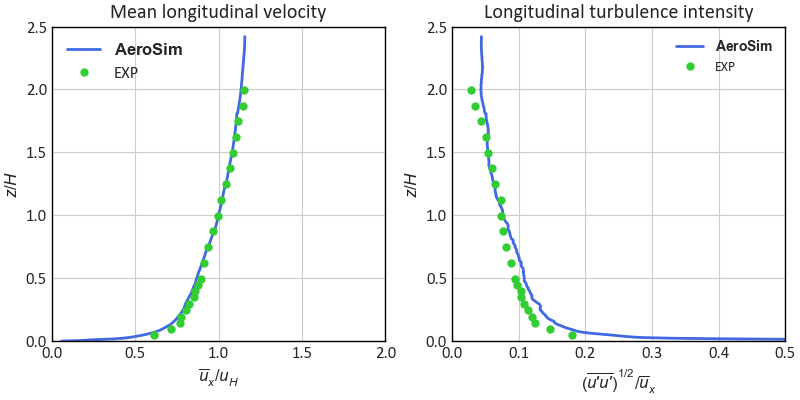
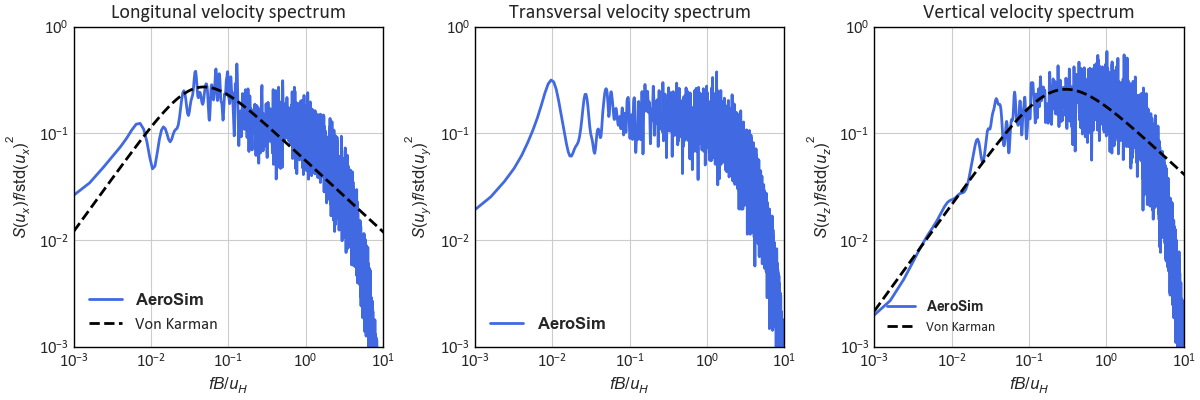
4. Results: Local Statistics#
Note
General comments:
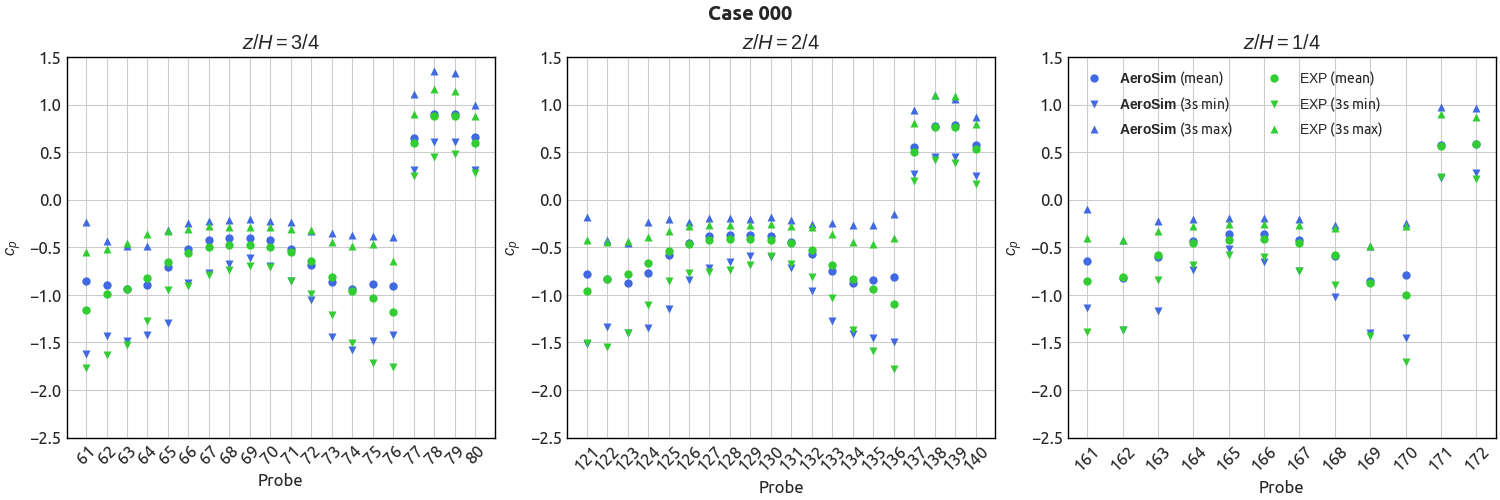
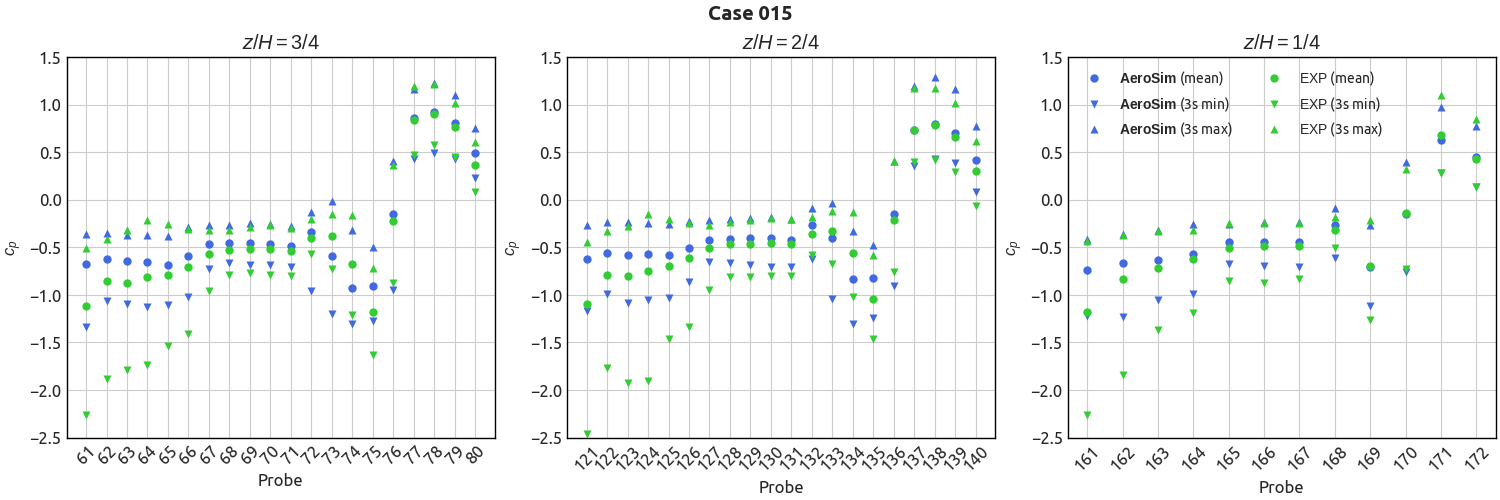
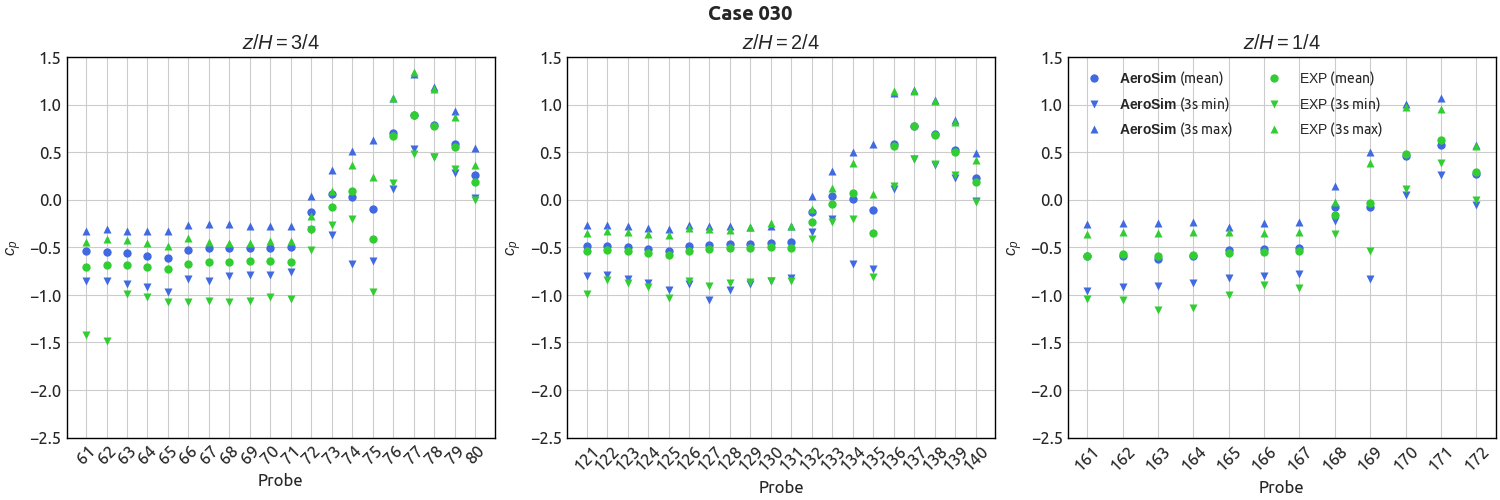
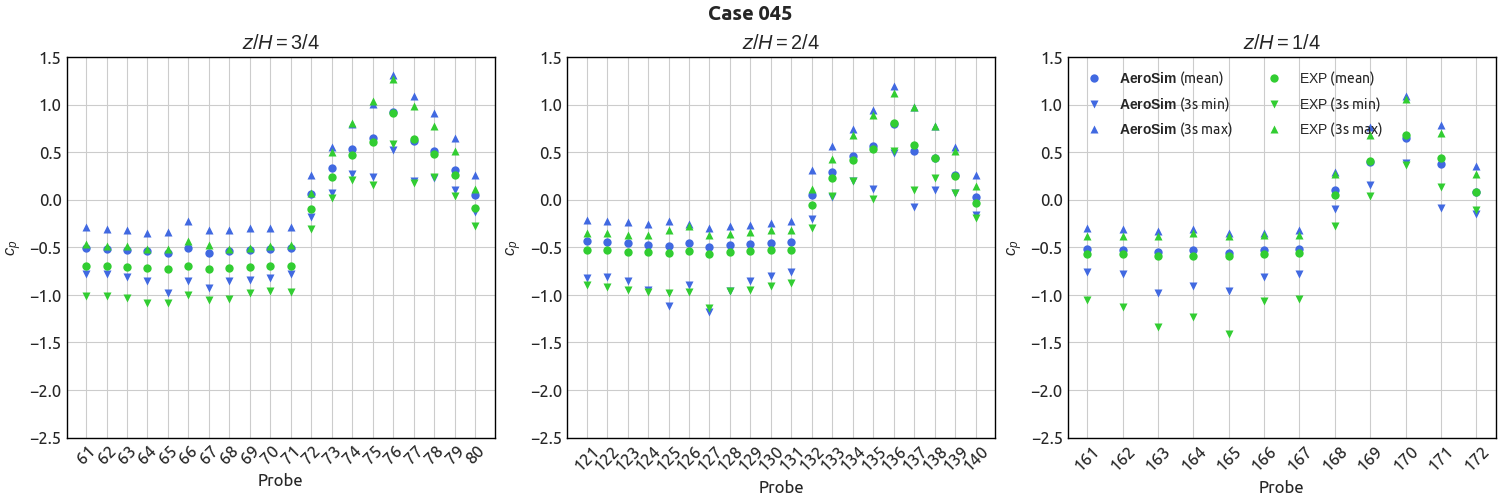
Experimental samples of the same size (\(T / CTS\)) of the numerical samples have been selected for comparison.
The peak pressure coefficients have been evaluated over moving averages of the original signals, with window size described in the plot legends.
Mean and Peak Pressures#
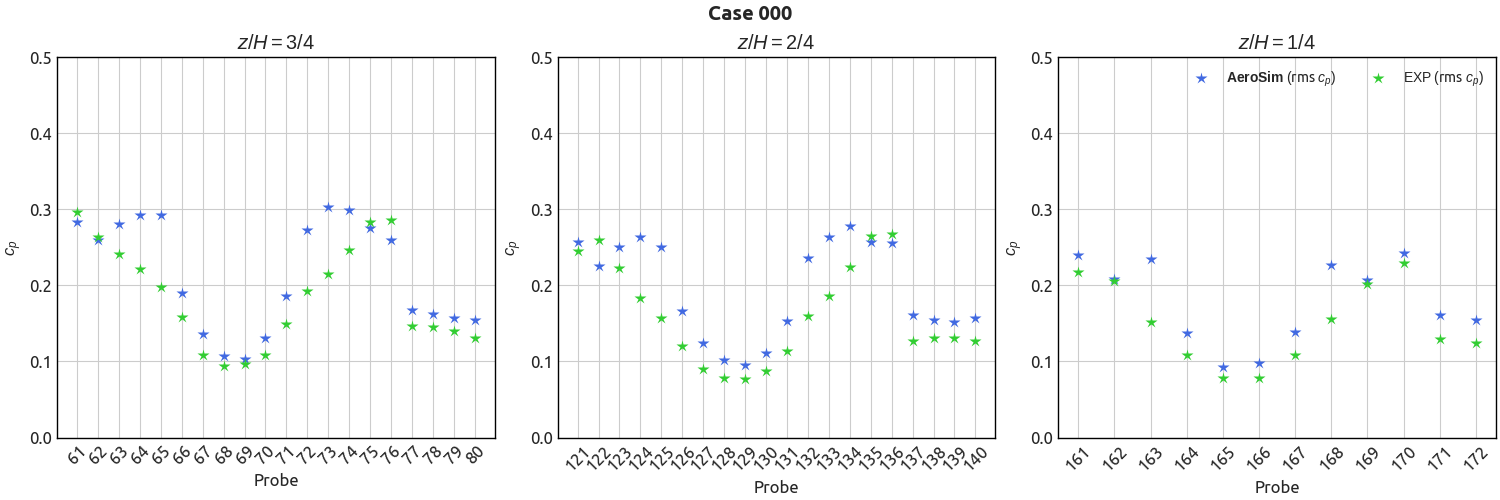
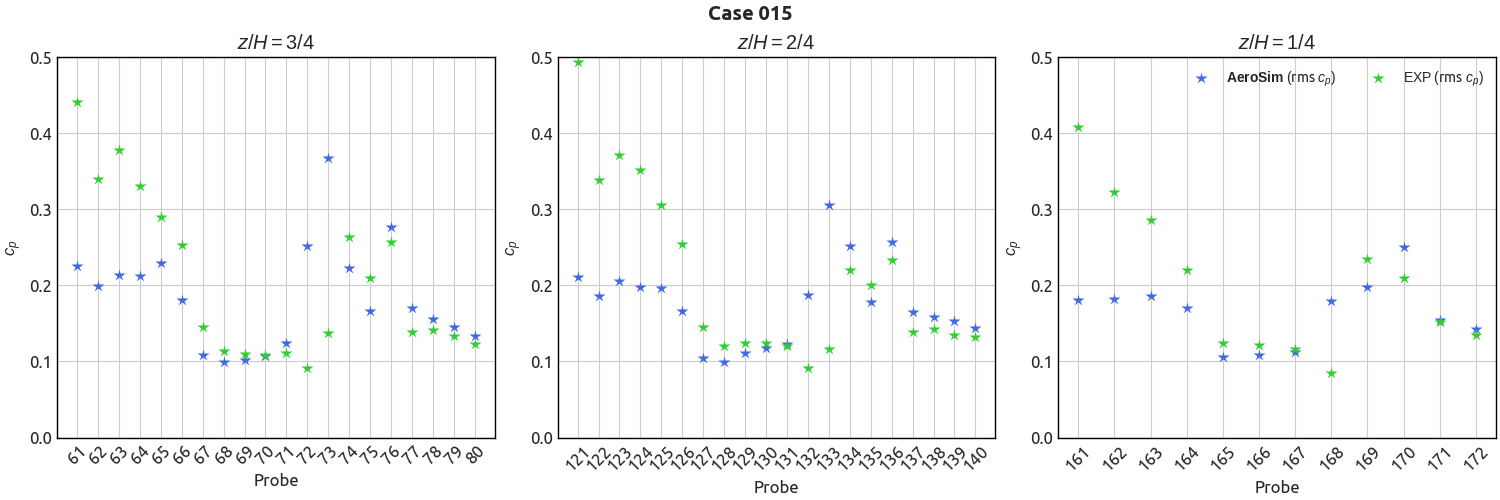
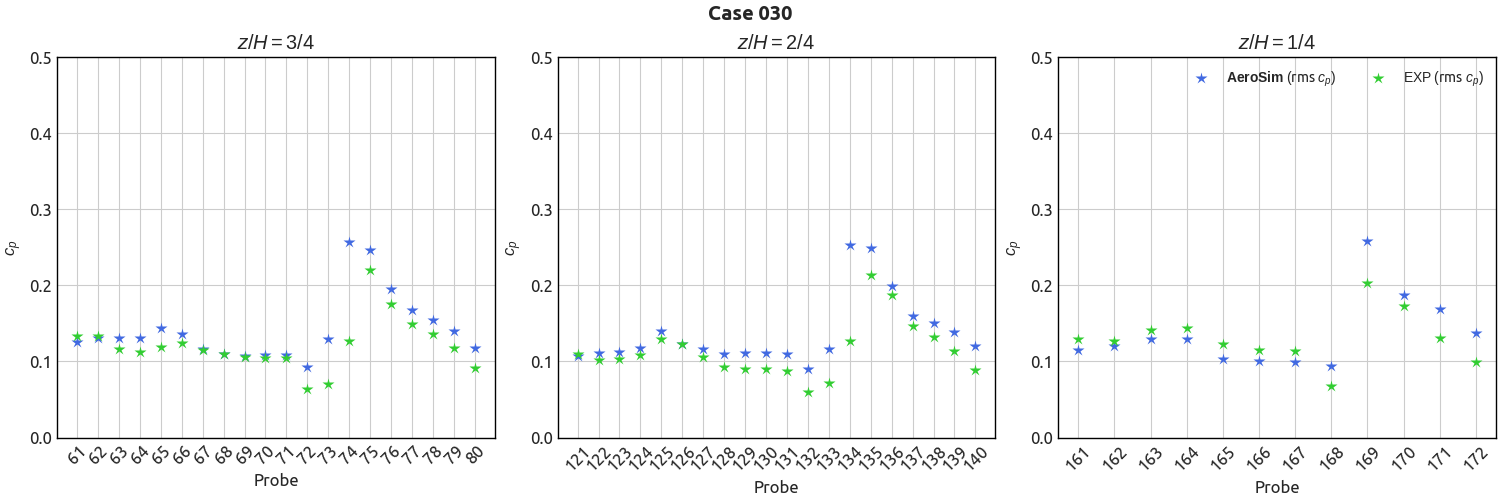
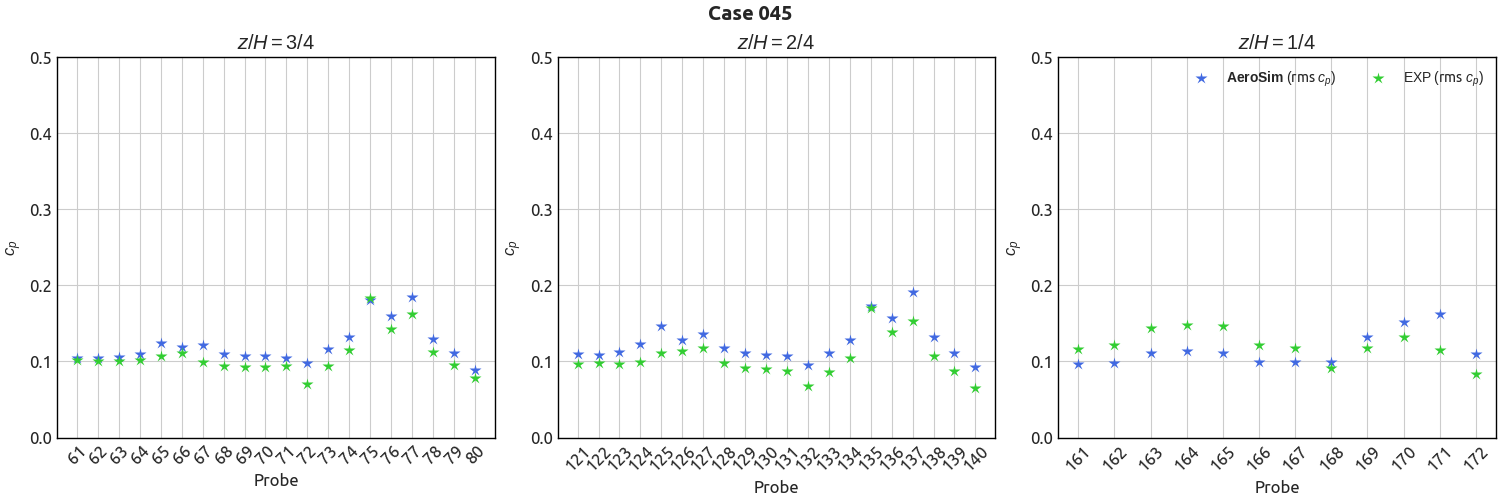
RMS Pressures#
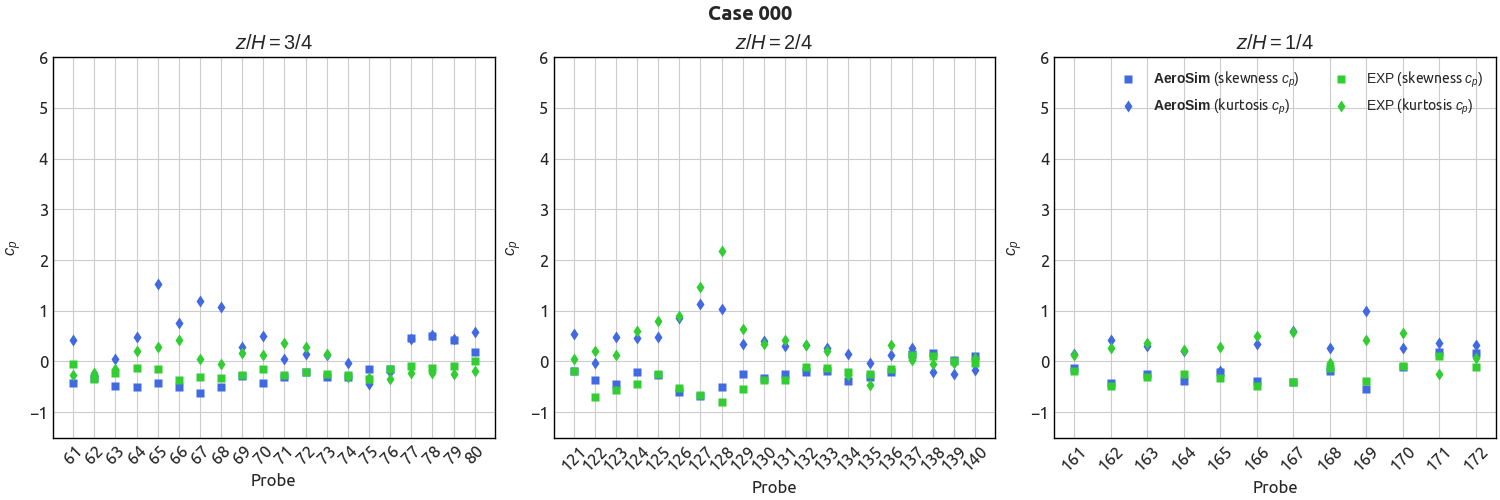
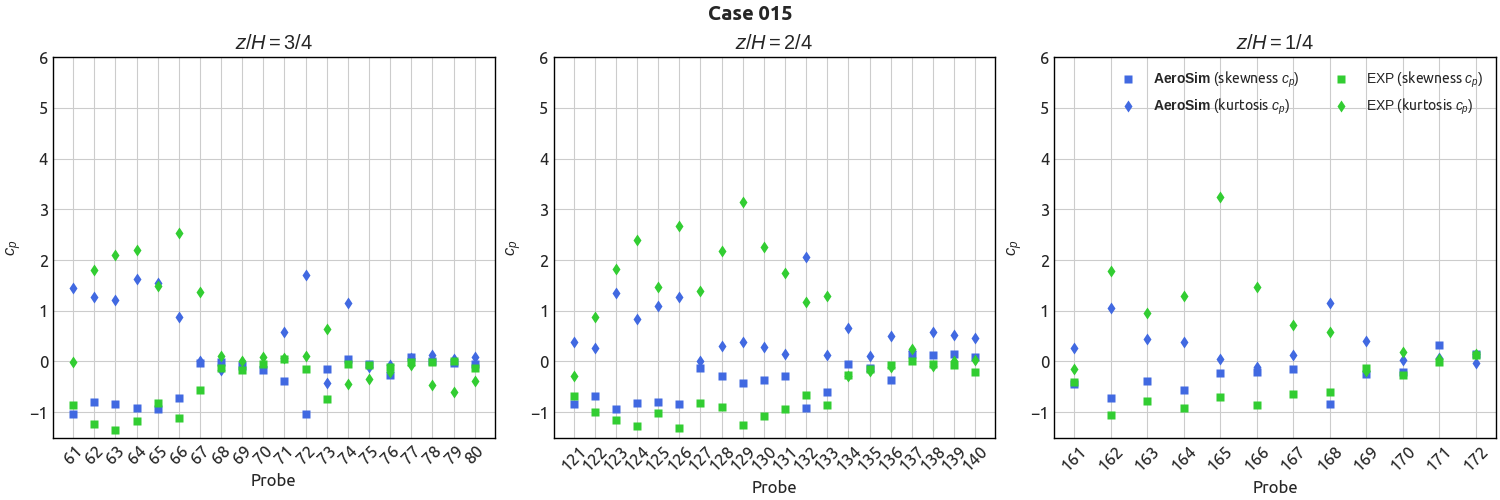
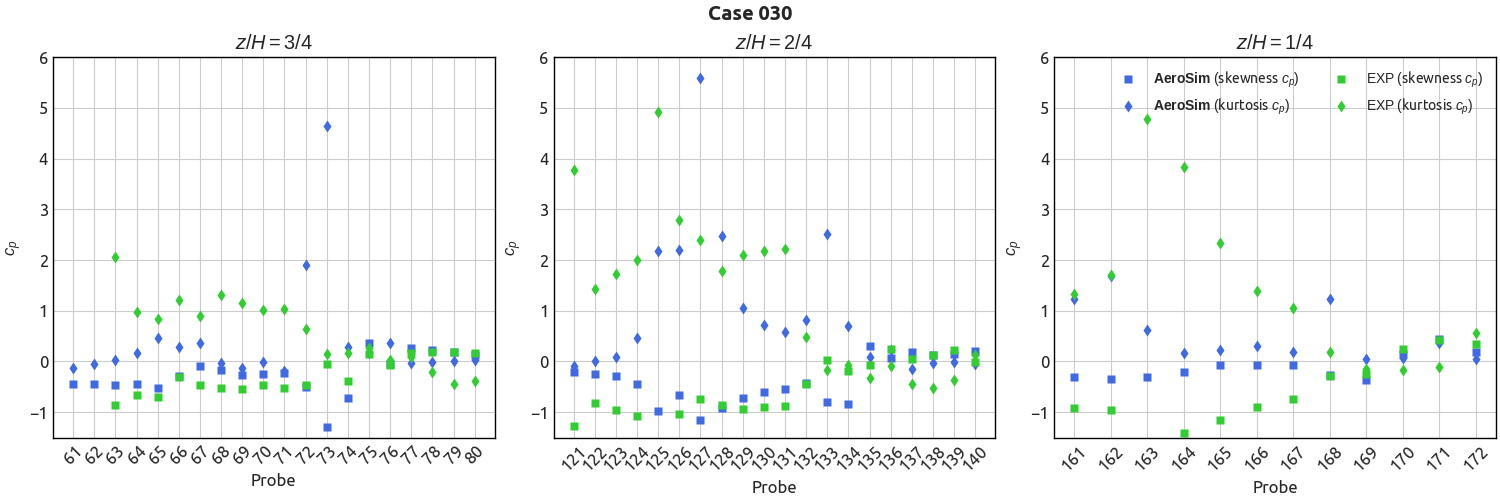
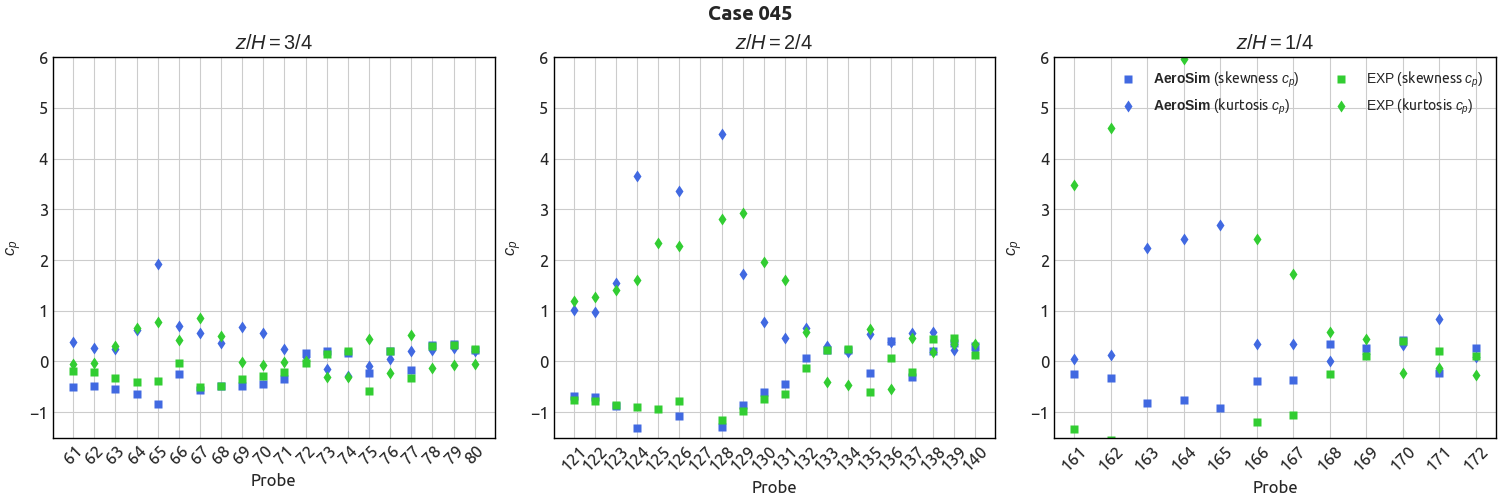
Skewness and Kurtosis#
Pressure Spectrum#
Changelog#
Execution Notes
01 May 2024
Uploaded point comparisons, simulations executed with Nassu release v1.5.4.

