NIST Building - Test 1#
1. Project Description#
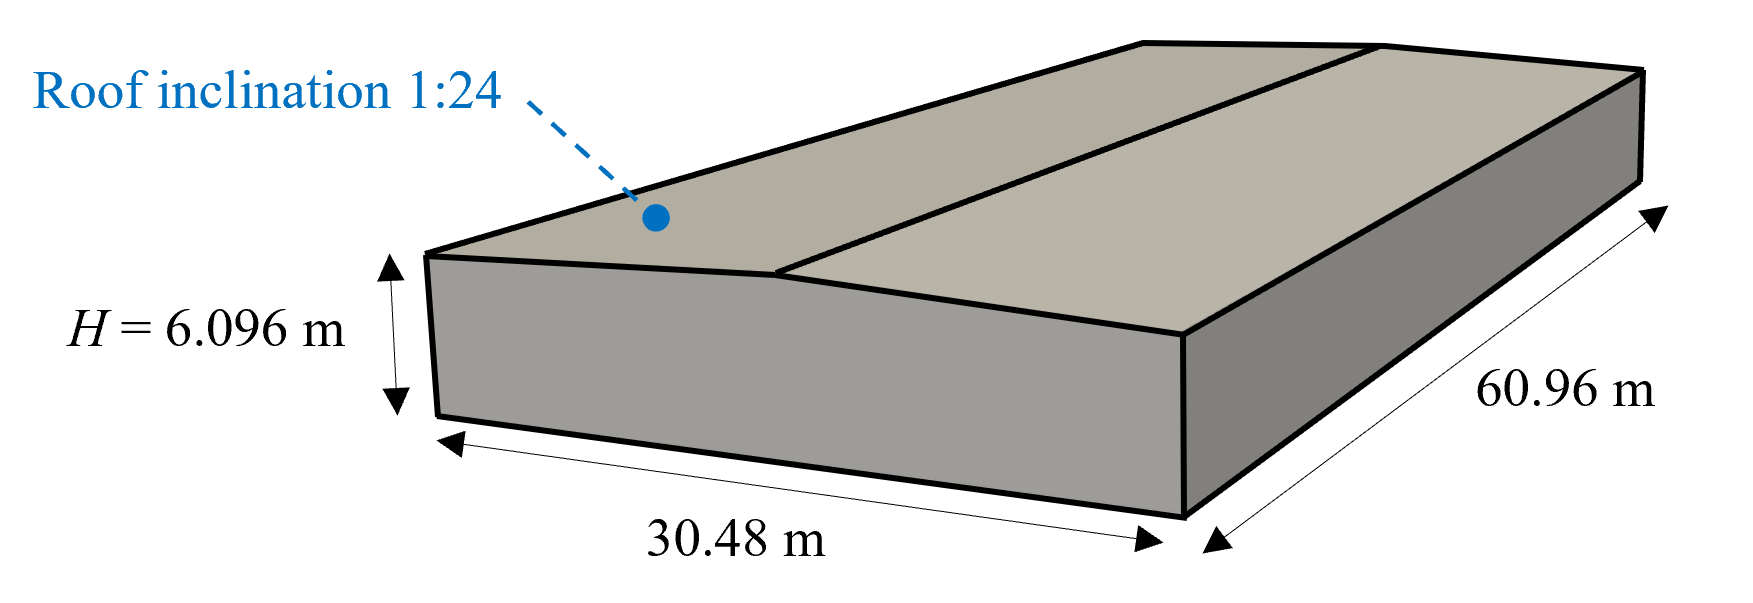
1.1. Geometries#
1.2. Source of Experimental Results#
Ho et al.[1]
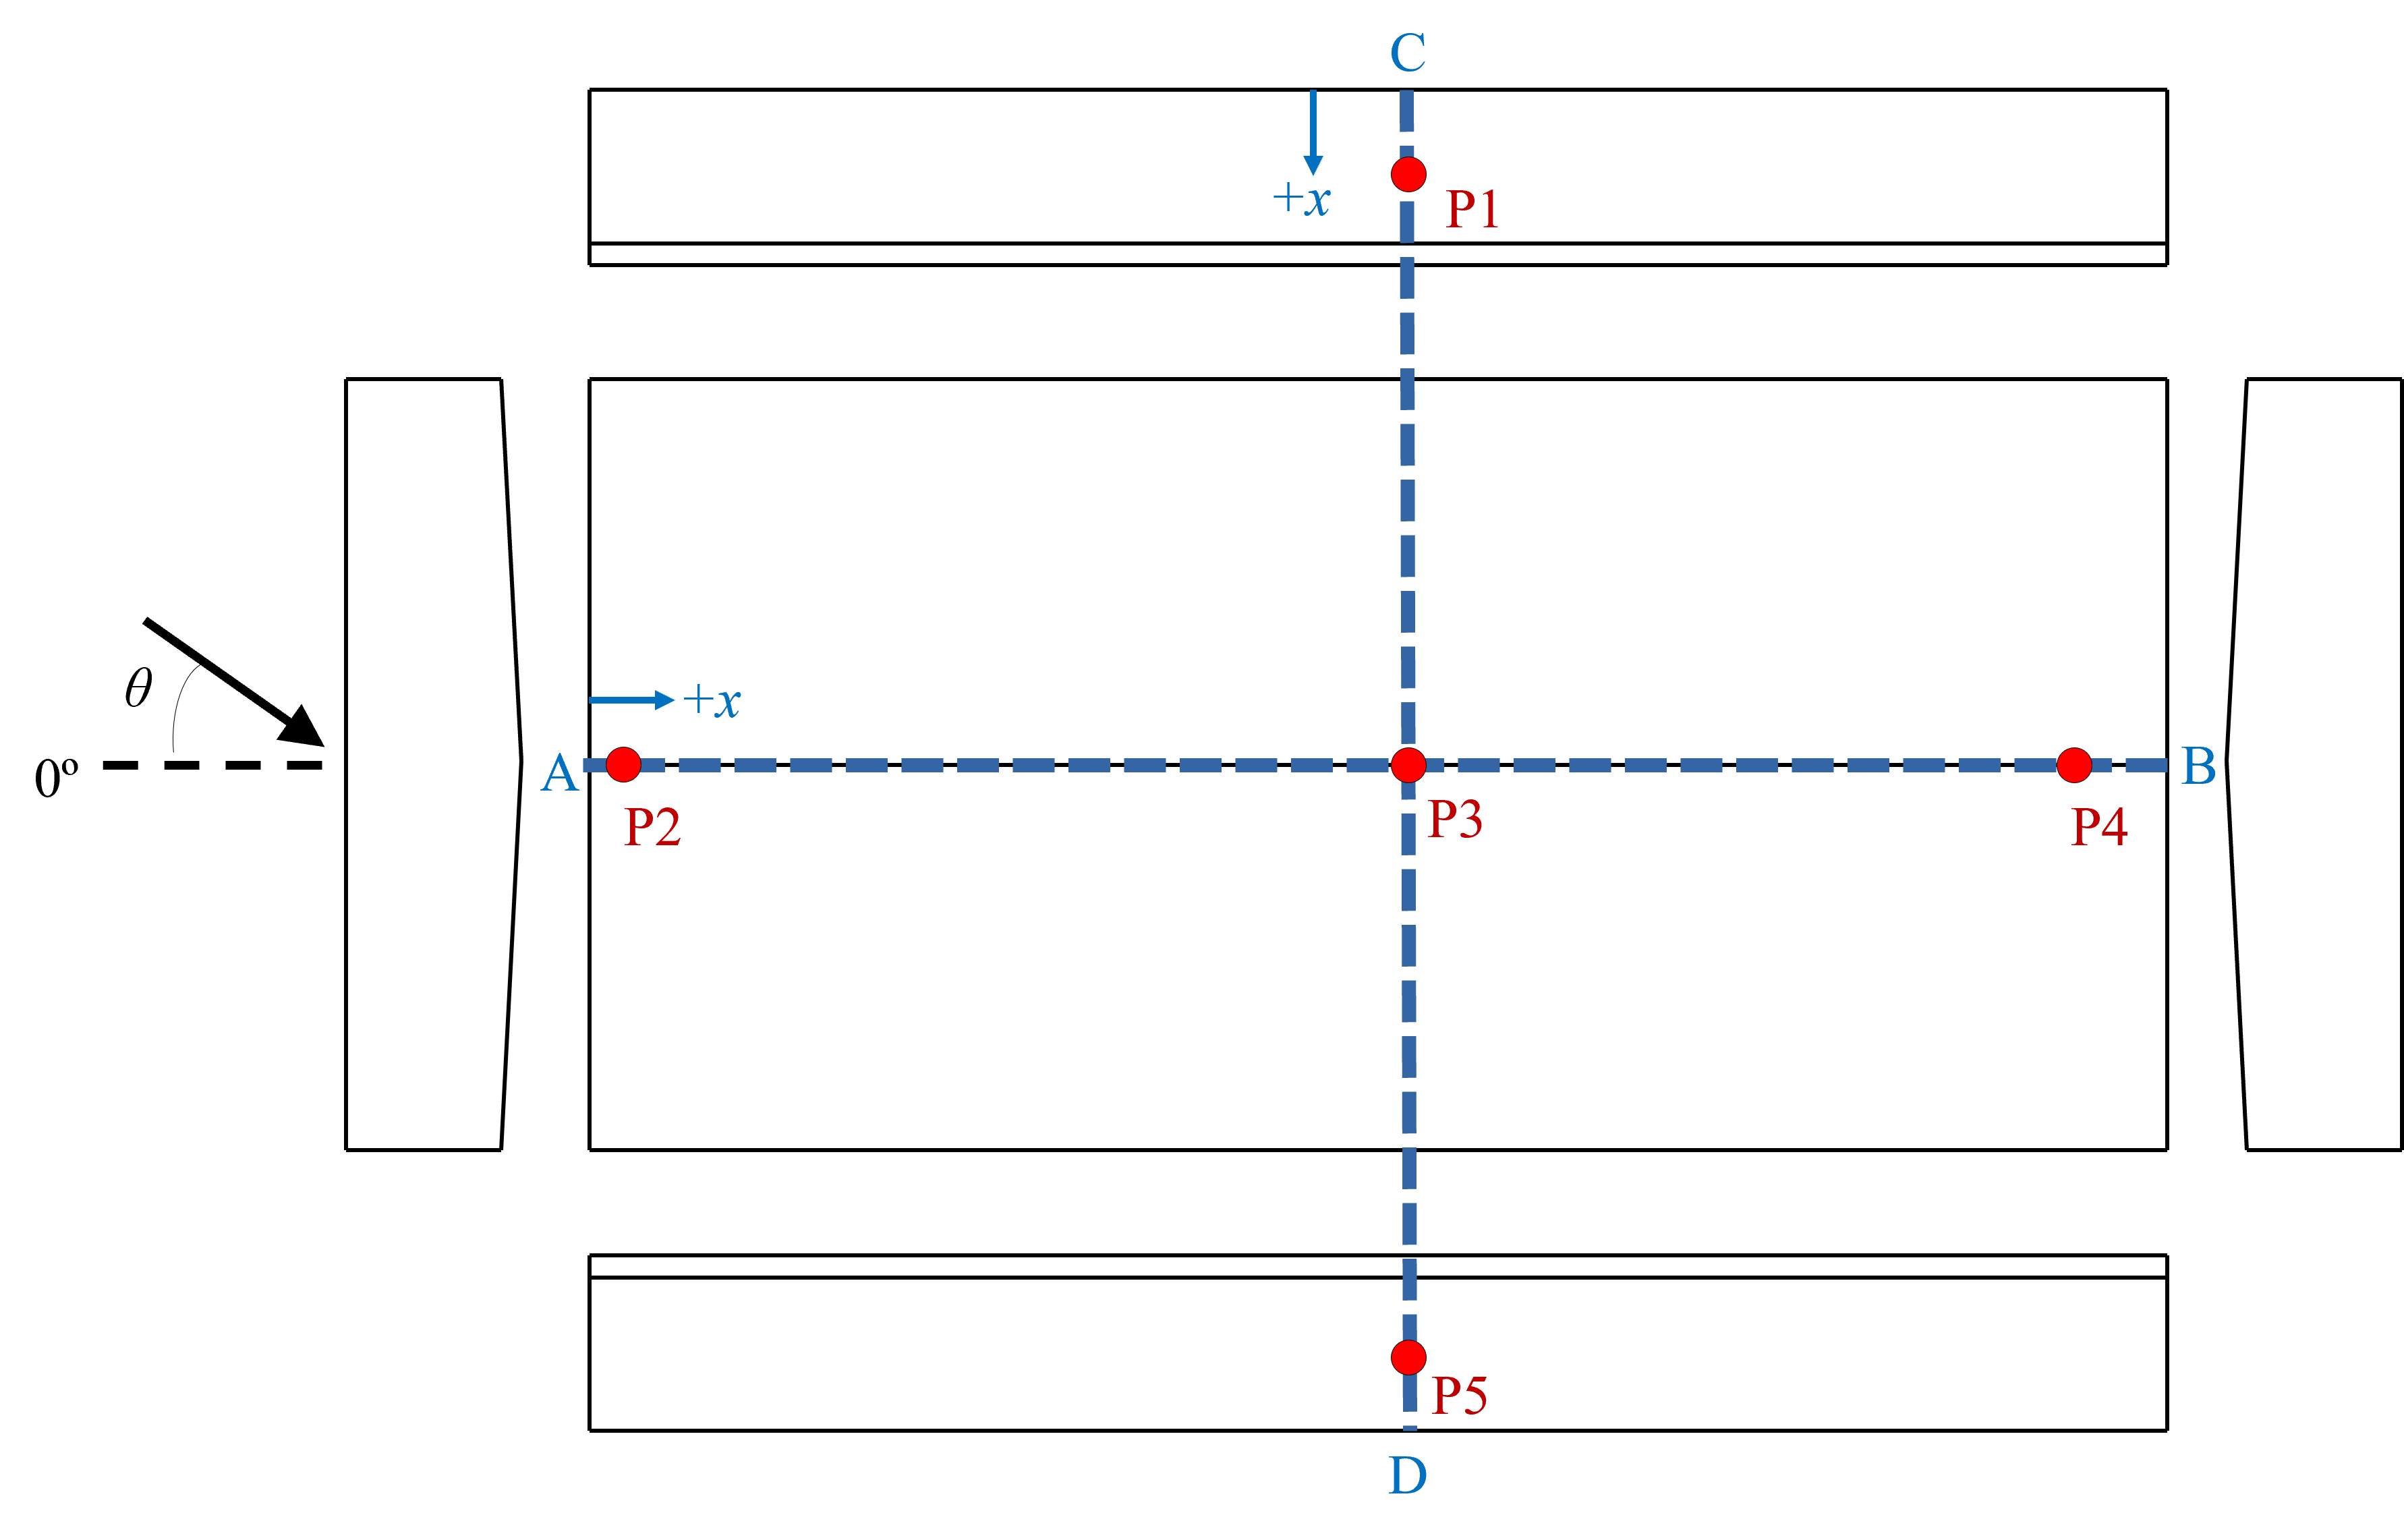
1.3. Probes Layout#
1.4. Analyzed Cases#

2. Simulation Setup#
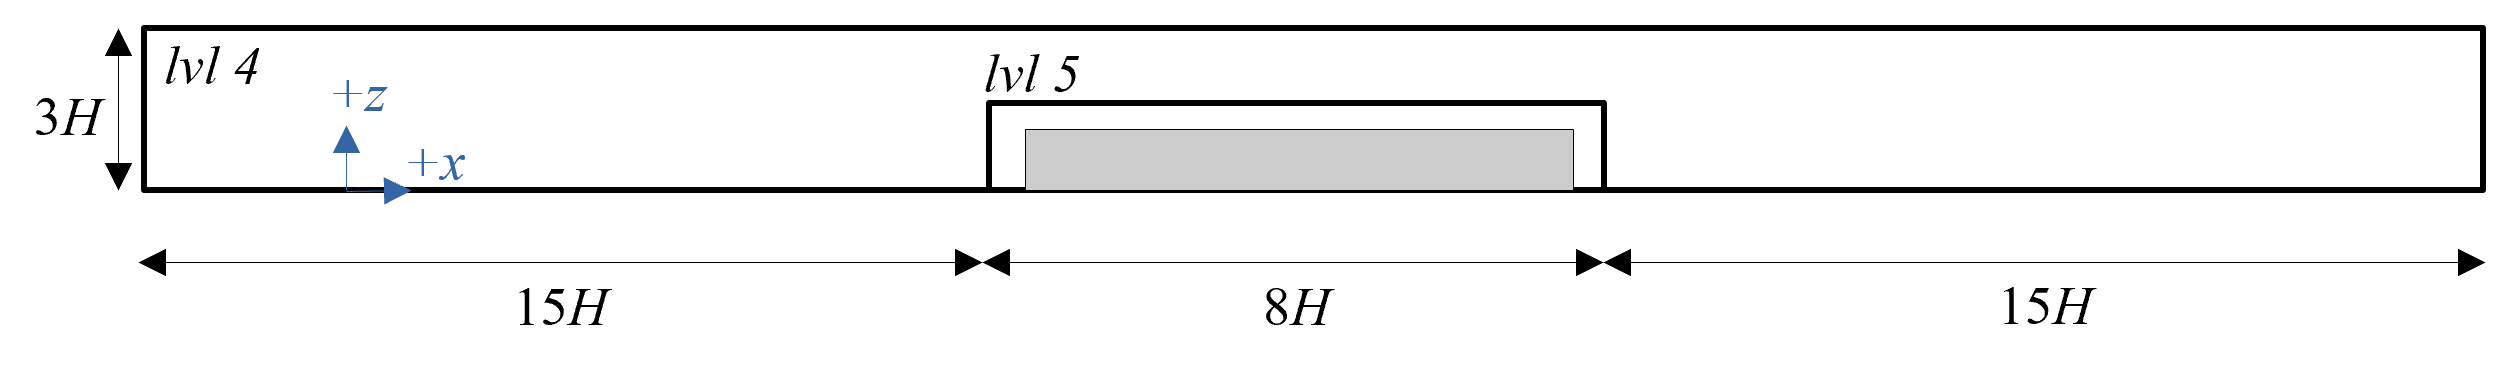
2.1. Grid Levels#
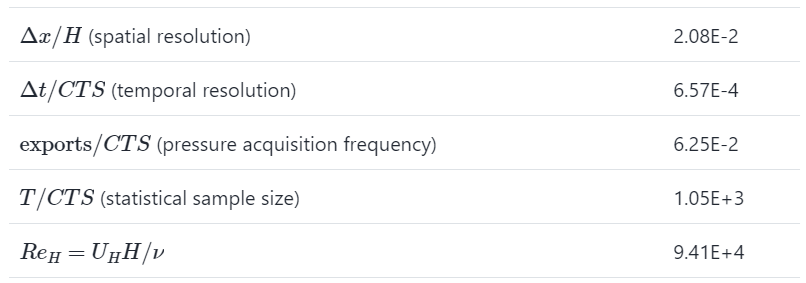
2.2. Simulation Parameters#
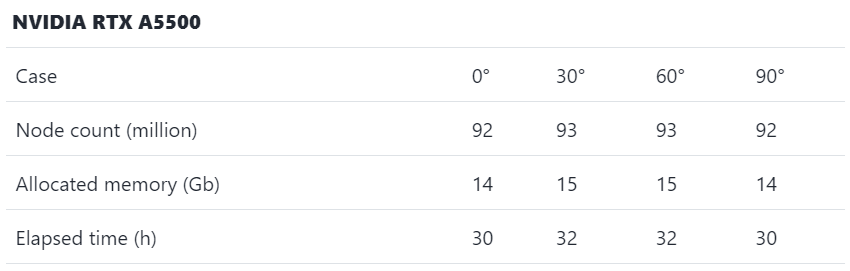
2.3. Computational Performance#
2.4. Public Project#
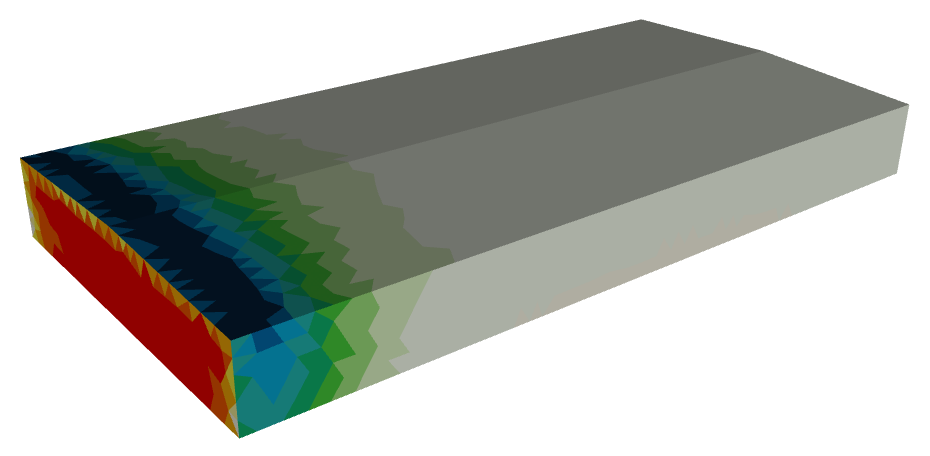
2.5. Visuals#
3. Inflow#
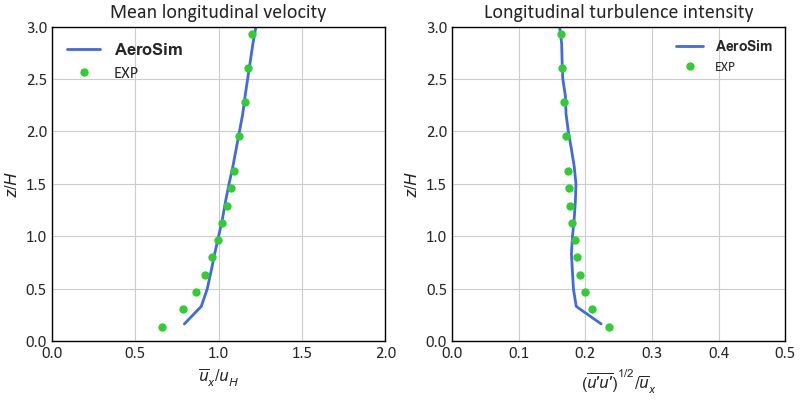
3.1. Wind Profiles#
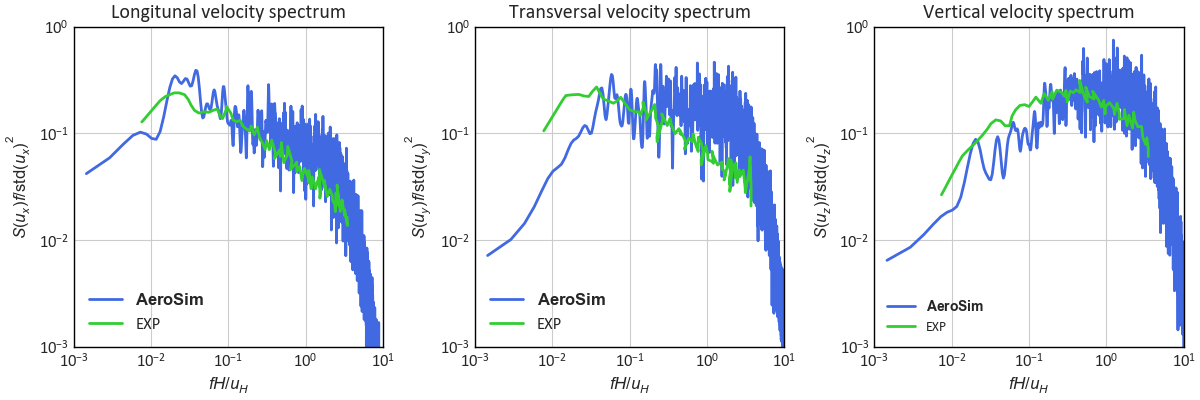
3.2. Wind Spectra#
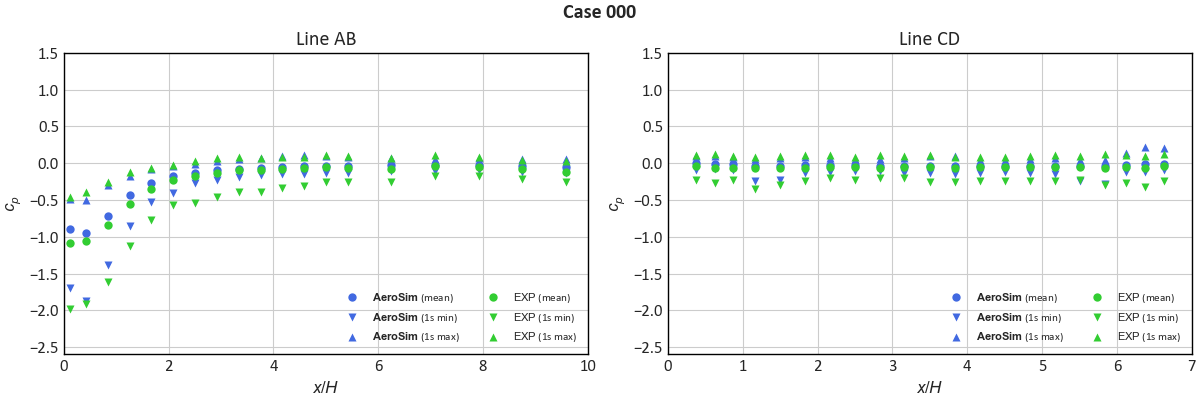
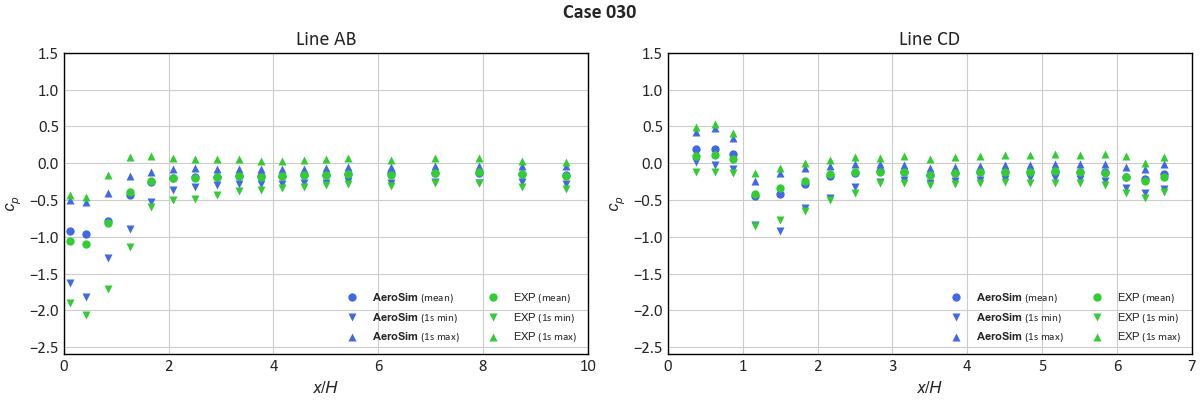
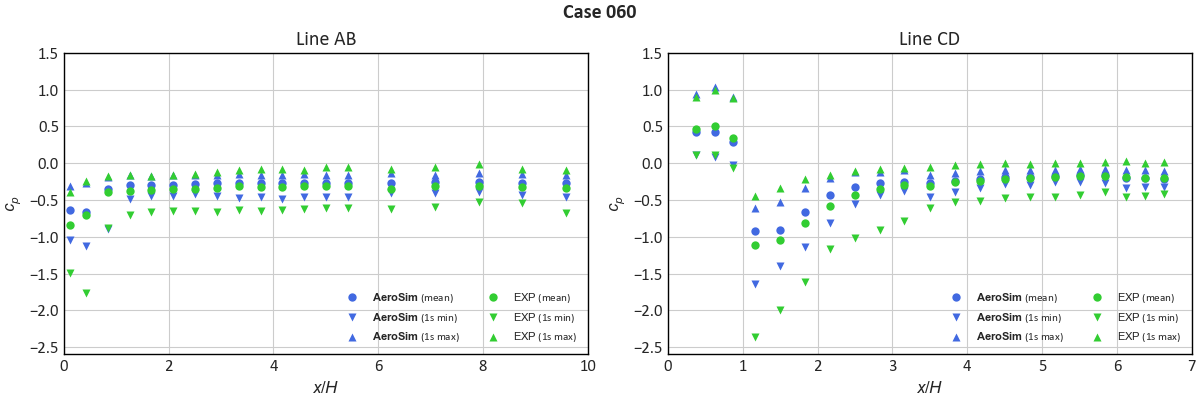
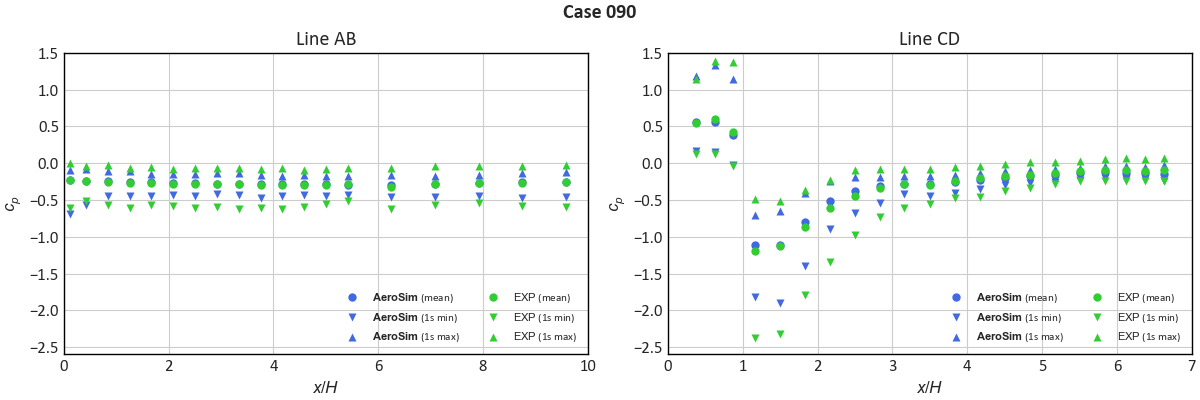
4. Results: Local Statistics#
4.1. General Comments#
Note
Experimental samples of the same size (\(T / CTS\)) of the numerical samples have been selected for comparison.
The peak pressure coefficients have been evaluated over moving averages of the original signals, with window size described in the plot legends.
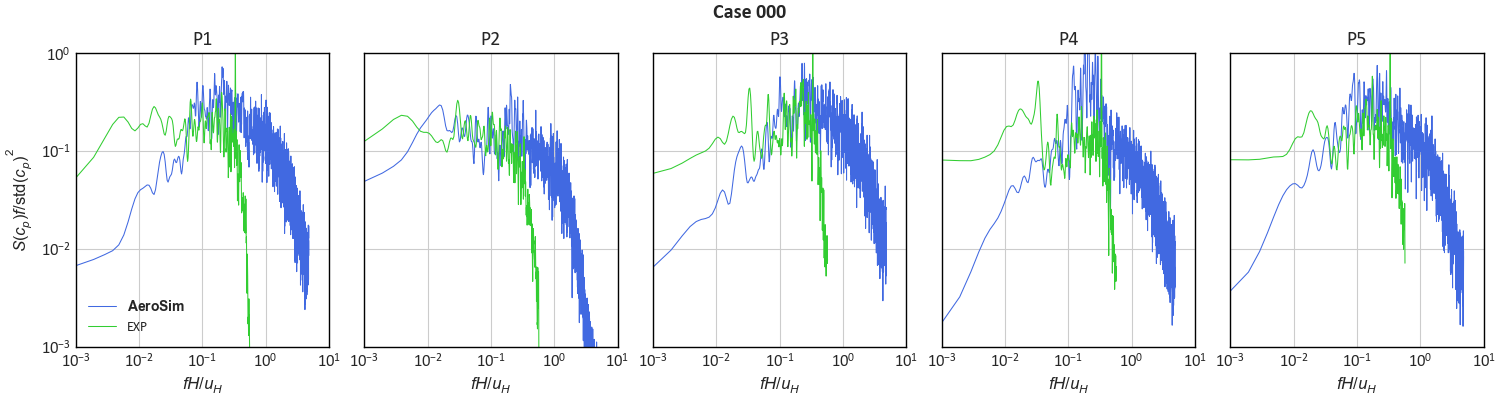
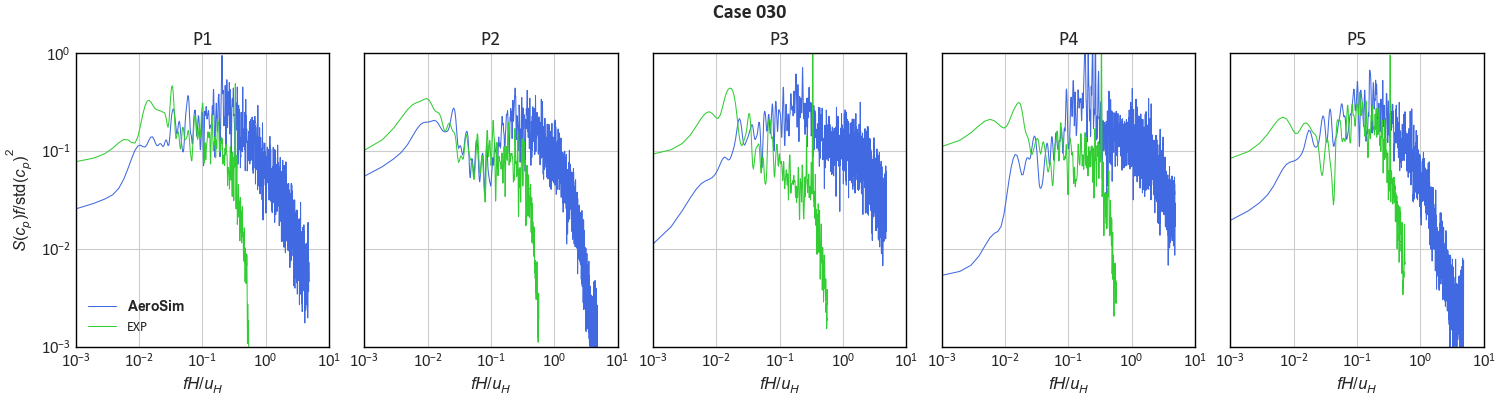
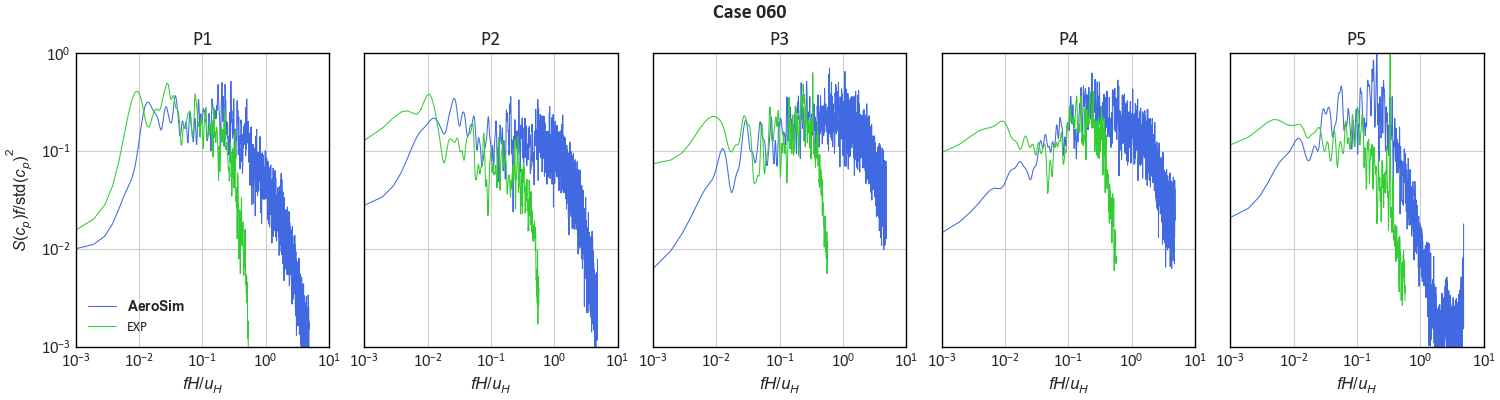
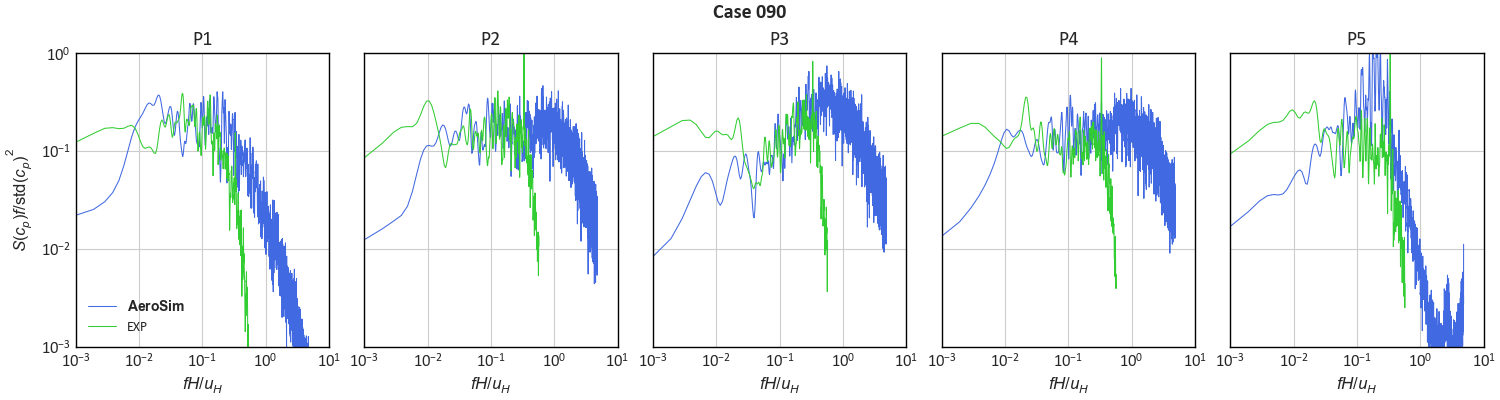
The acquisition frequency of the numerical calculations is significantly higher than that of the experiments, hence the numerical spectra show a higher cut-off.
4.2. Mean and Peak Pressures#
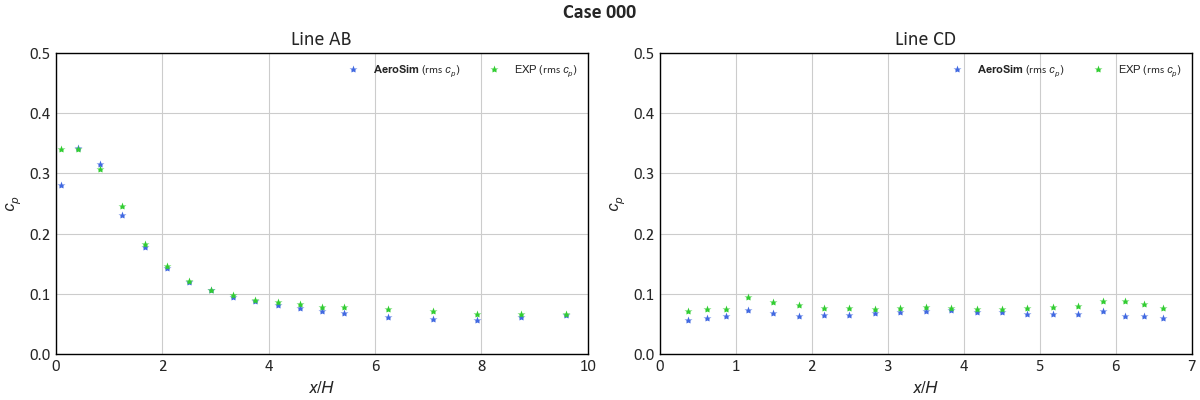
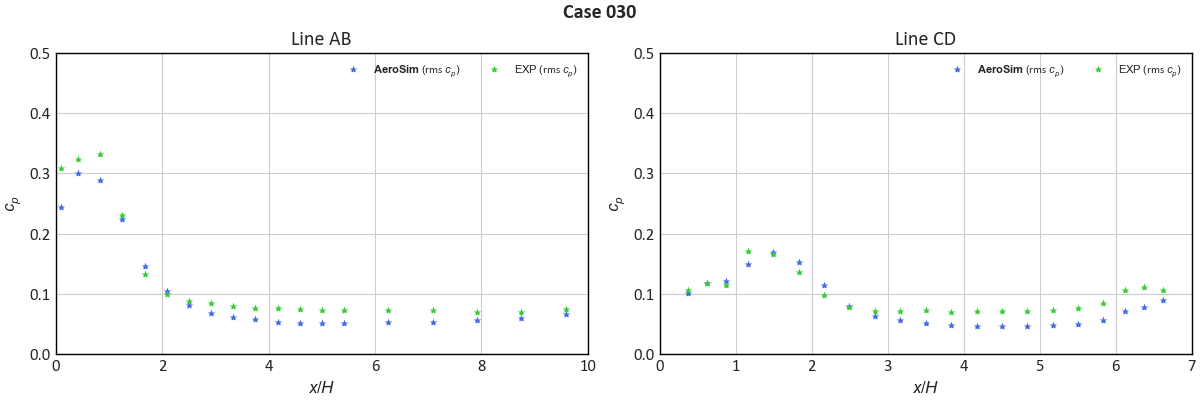
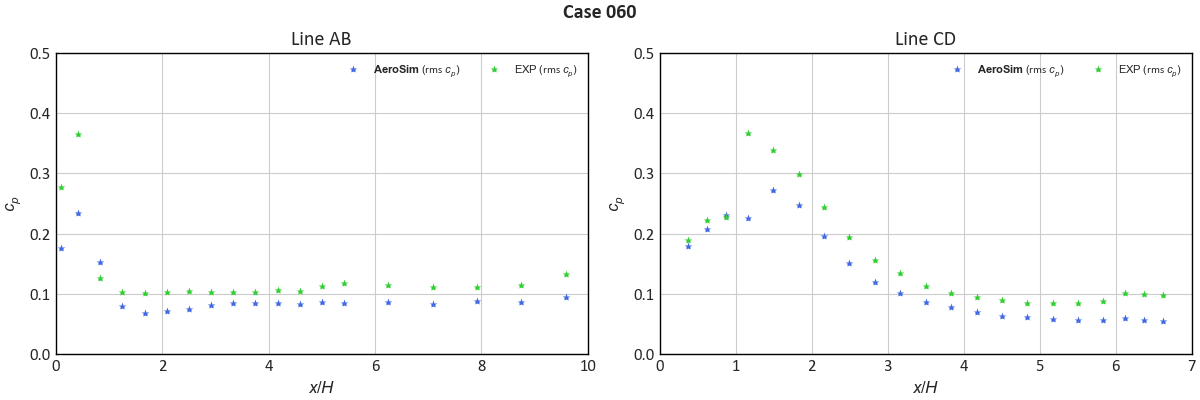
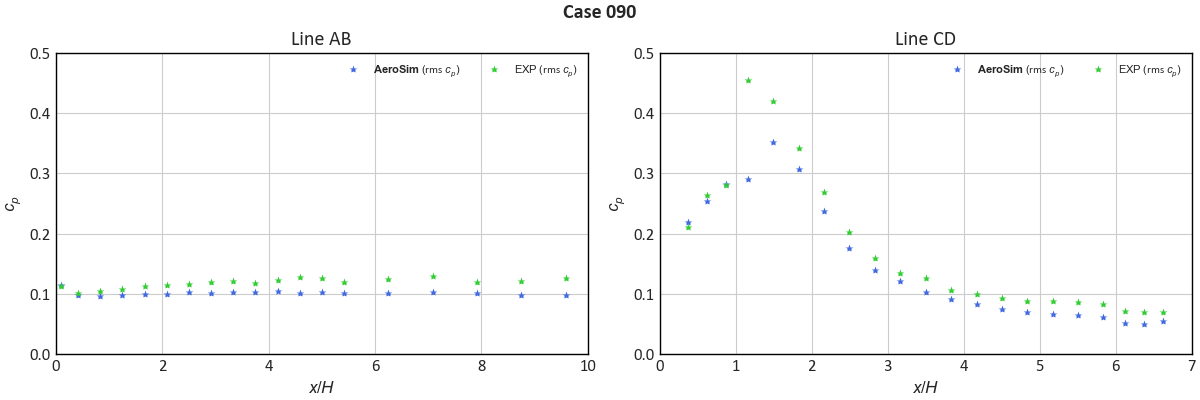
4.3. RMS Pressures#
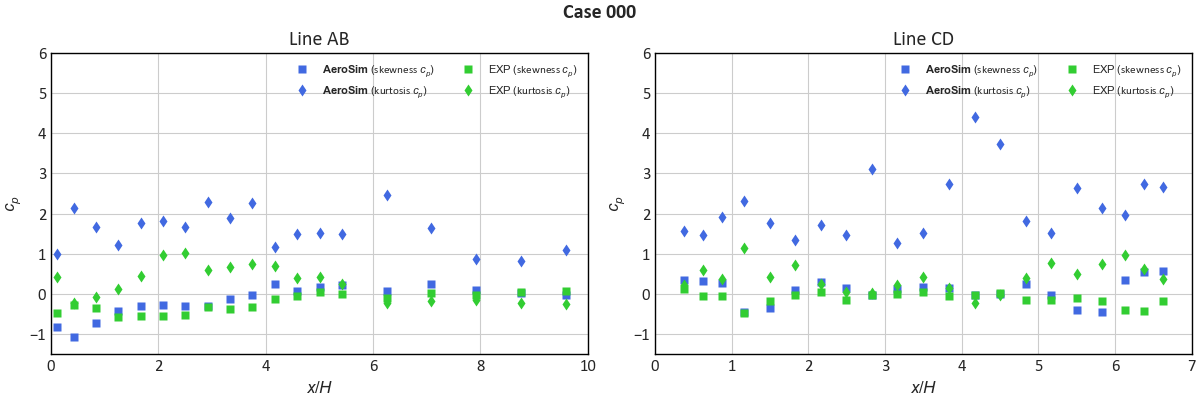
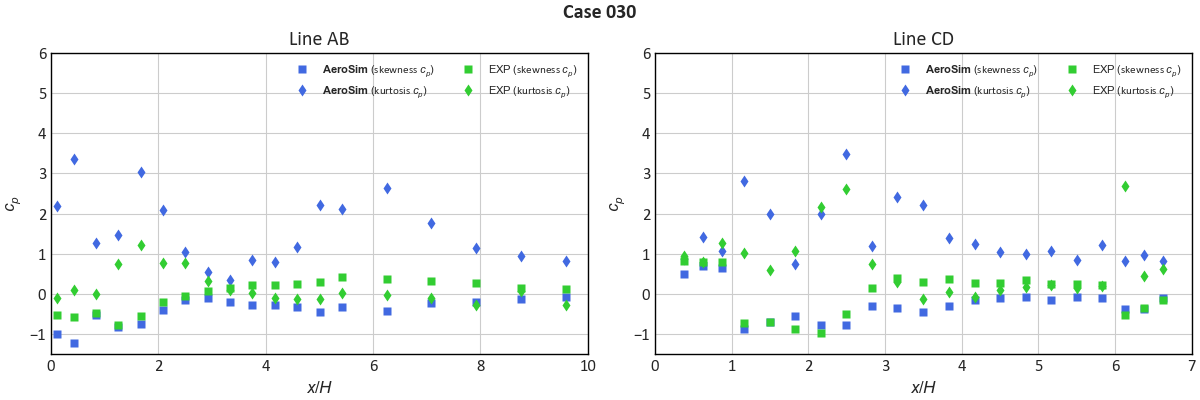
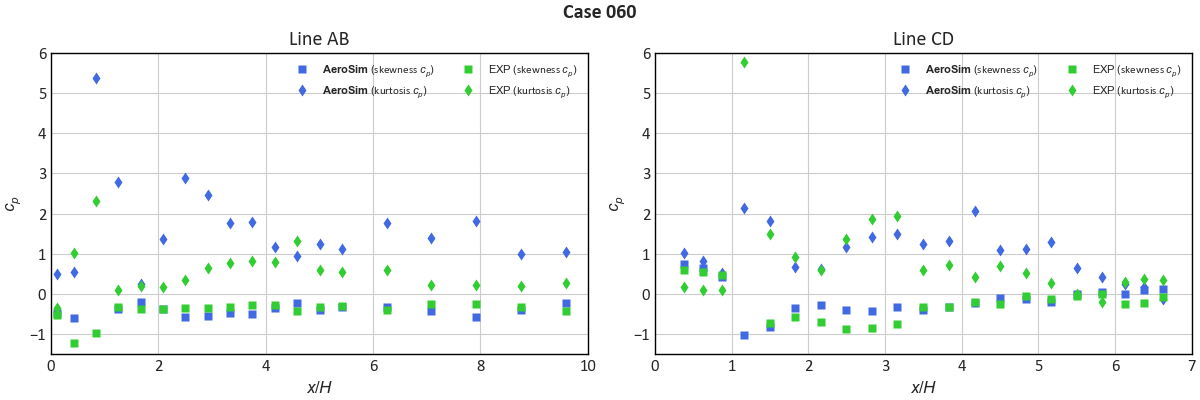
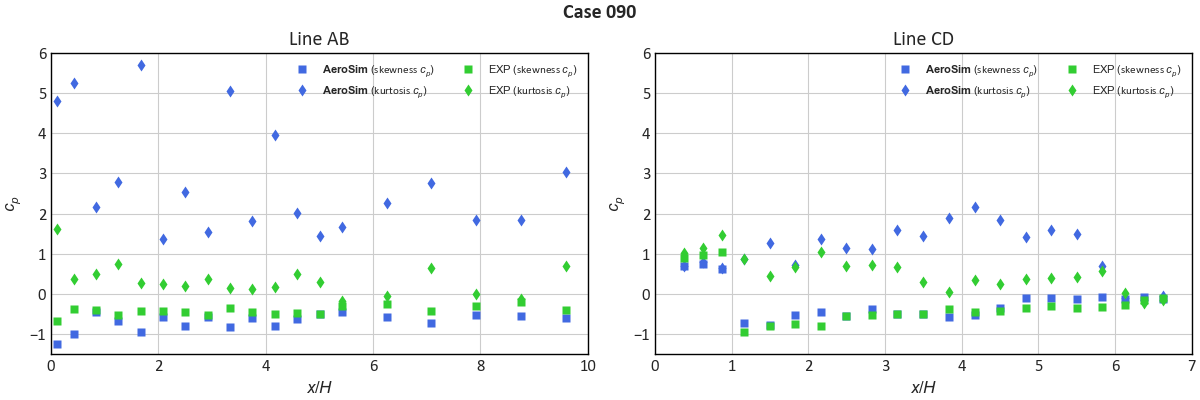
4.4. Skewness and Kurtosis#
4.5. Pressure Spectrum#
Changelog#
Execution Notes
29 April 2024
Uploaded point comparisons, simulations executed with Nassu release v1.5.4.