High-Rise Building (CAARC)#
1. Project Description#
The CAARC building is widely recognized as a standard calibration geometry for wind tunnel testing. It is a rectangular prismatic model with dimensions of 30 × 45 × 180 meters. The CAARC model is extensively used for calibrating pressure coefficient measurements and validating dynamic analysis methodologies across different laboratories. In 2007, during the 12th International Conference on Wind Engineering (ICWE12), standardized dynamic parameters for the CAARC_Building were established. Comparative results from various laboratories are available in [1].
The velocities were measured at an equivalent height \(H=180m\). The wind directions chosen to be simulated were:
Wind direction |
0 \(^\circ\) |
30 \(^\circ\) |
60 \(^\circ\) |
90 \(^\circ\) |
2. Simulation Setup#
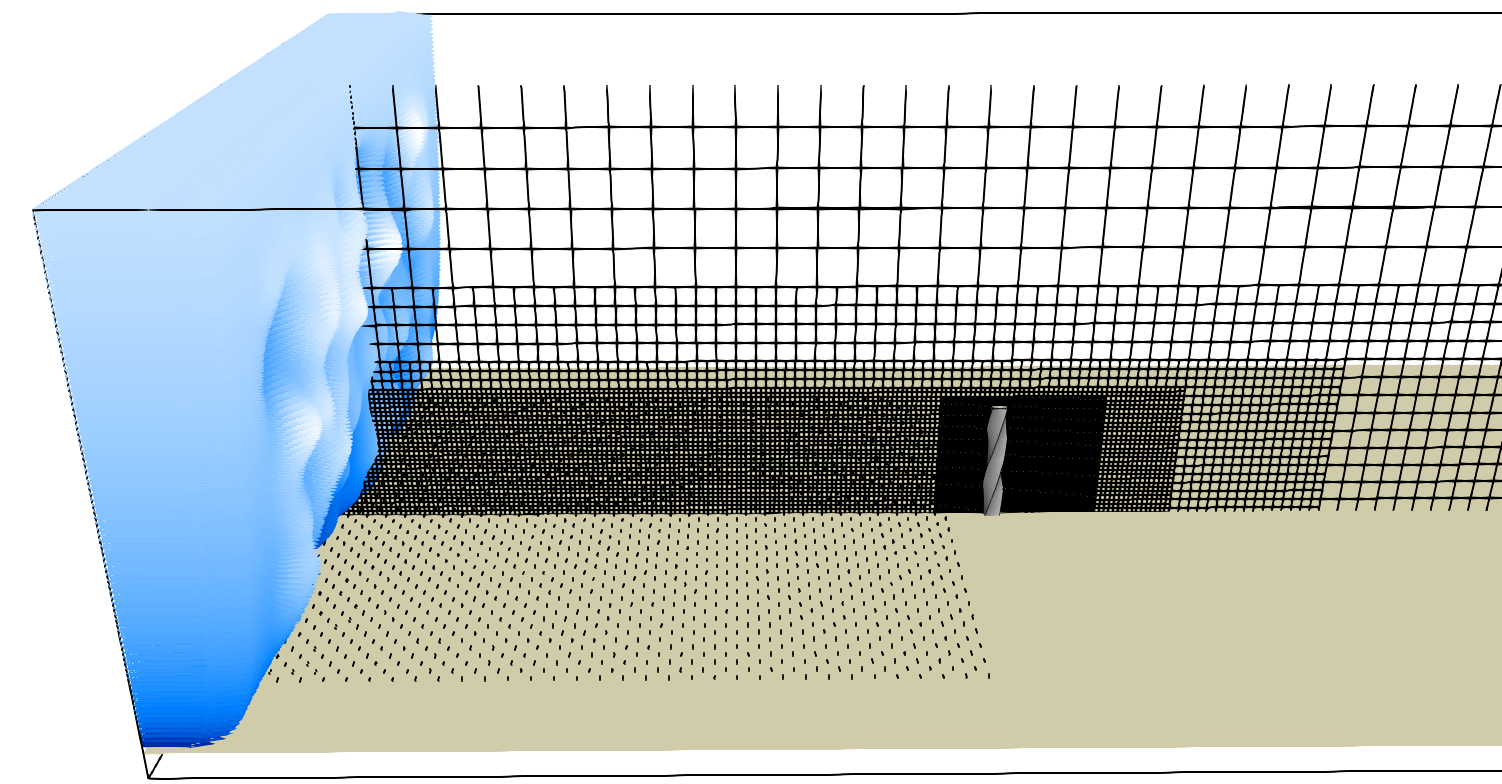
The Synthetic Eddy Method (SEM) boundary condition is applied at the inlet of the computational domain. Solid fins are distributed across the floor to ensure the desired velocity and turbulence profiles during flow development length. A Neumann boundary condition is applied at the remaining boundaries. The grid resolution for the atmospheric profile is set such that \(H / \Delta x = 480\) at finest refinement level, and \(H / \Delta x = 120\) for the ABL refinement.
3. Results: Wind Loads#
Wind loads are evaluated using both static and dynamic analyses, with the results compared against experimental data obtained from wind tunnel testing.
Static Loads#

Dynamic Loads (damping 1.0%)#

Dynamic Loads (damping 2.5%)#

Acceleration (damping 1.0%)#

Acceleration (damping 2.5%)#

4. Results: Performance Benchmark#
We also use the CAARC building as a reference case to assess the software’s performance, comparing processing times with those reported in other studies from the literature. Although these studies are not necessarily focused on performance evaluation, they offer a useful benchmark for comparison.
AeroSim |
||||
Solver |
Nassu |
XFlow v2020x |
OpenFOAM v2.3.0 |
OpenFOAM-8 |
Num. Method |
LBM |
LBM |
FVM |
FVM |
Min \(\Delta x / H\) |
1/480 |
1/480 |
1/1,960 |
1/585 |
Mesh Elements |
35 million |
6.2 million |
12 million |
9.85 million |
Physical Time (s) |
2200 |
1800 |
1200 |
3800 |
Wall Time (h) |
~15 |
~21 |
~260 |
~180 |
Device |
NVIDIA RTX A5500 |
HPC device 2.6GHz (128 cores) |
Intel Xeon 2.4GHz (96 cores) |
AMD Rome 7502 2.5GHz (128 cores) |
SSPSH* (s/h) |
~146 |
~86 |
~4.6 |
~21 |
SSPSH: seconds simulated per simulation hours
Changelog#
20 Jun 2025: Added case to portfolio