Urban Center (Niigata)#
1. Project Description#
The current study is a reproduces Niigata pedestrian comfort assessment available in Guidebook for CFD Predictions of Urban Wind Environment from Architectural Institute of Japan wth AeroSim’s CFD solver.
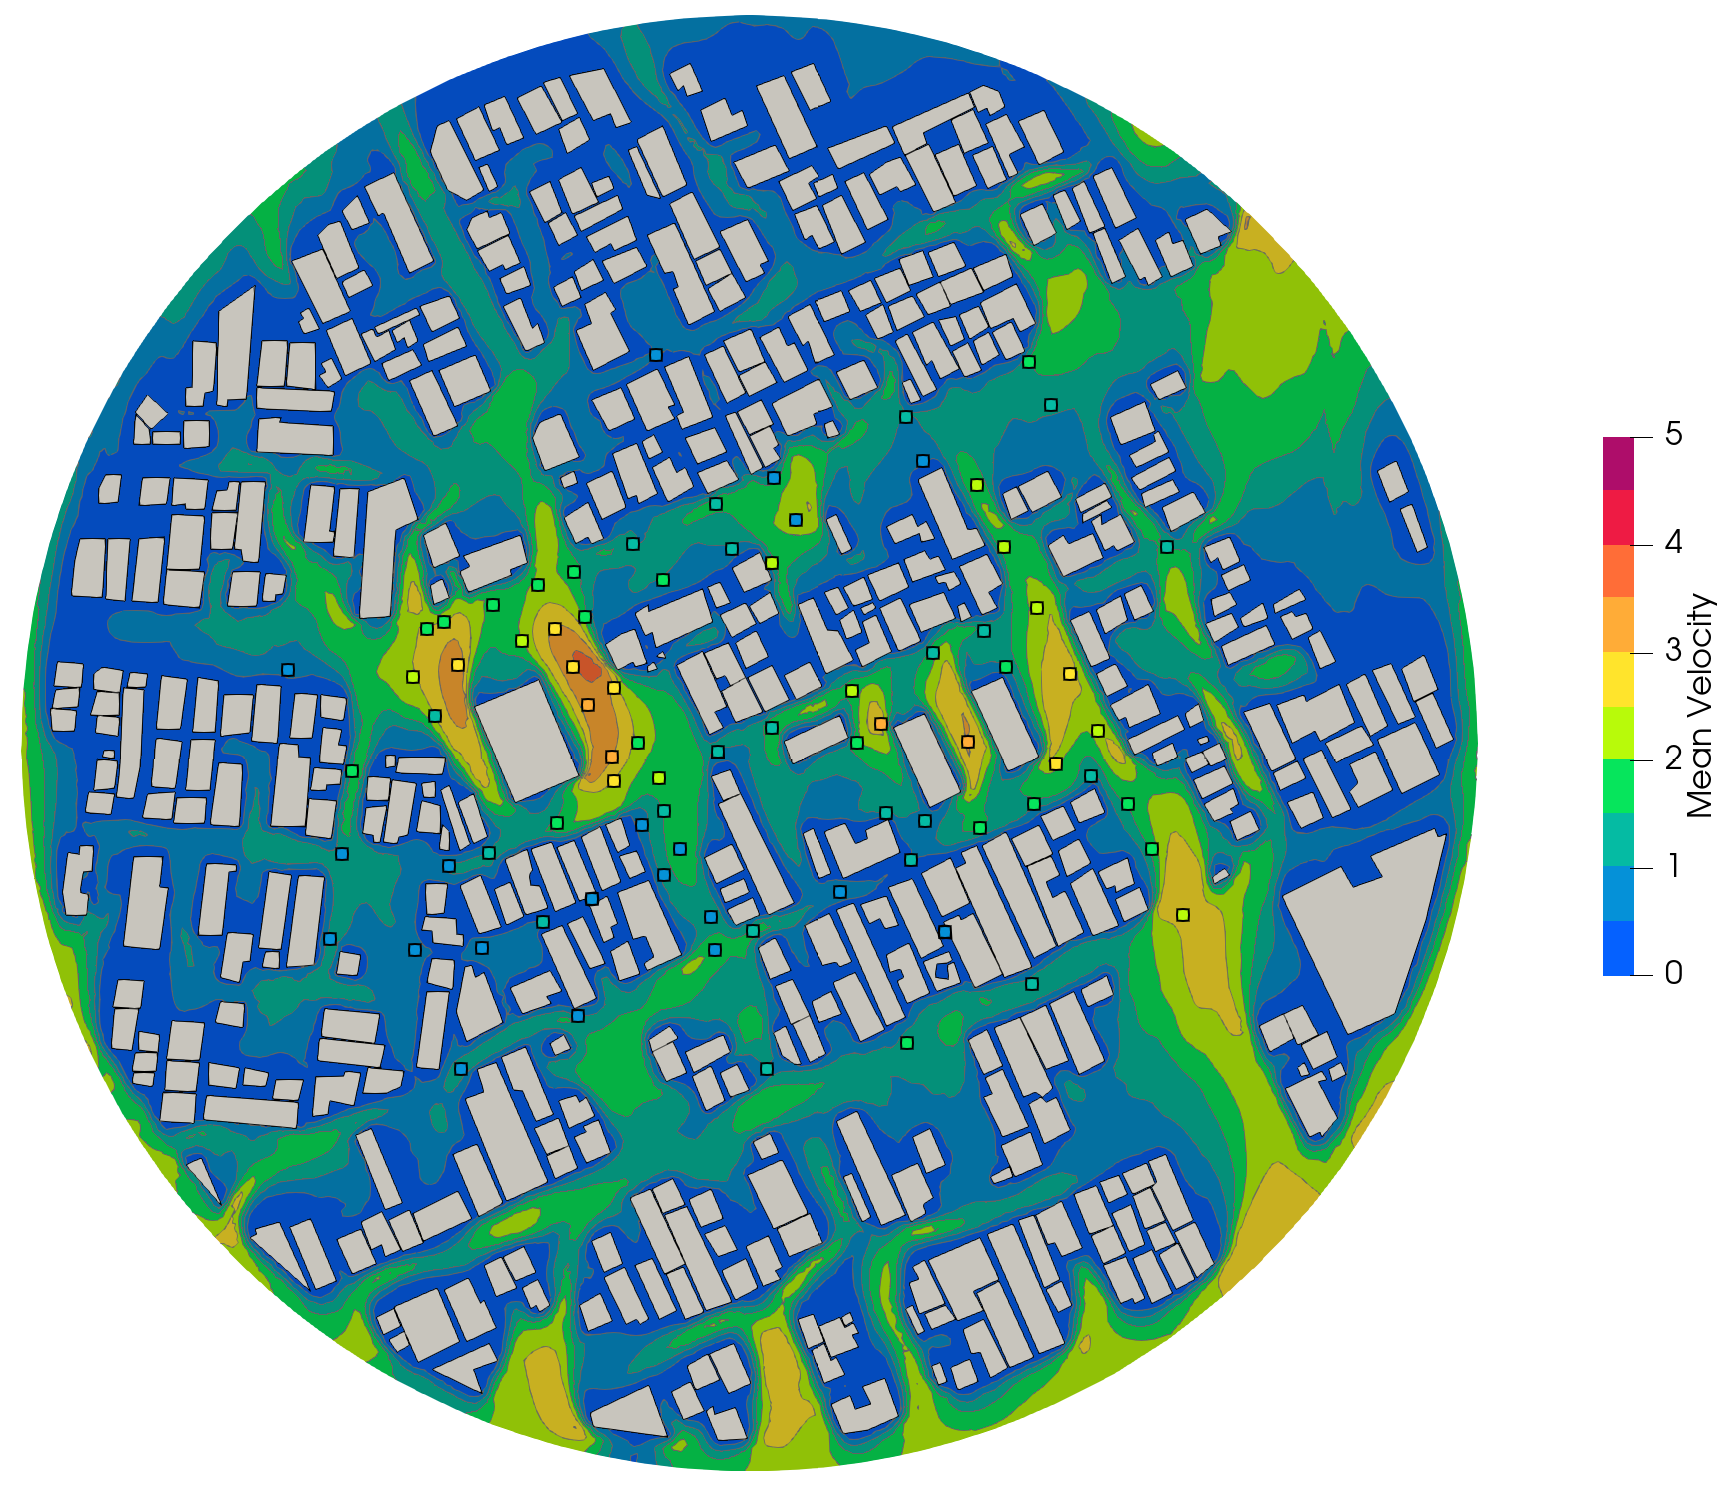
The case consists of building complexes with simple building shape in actual urban area, the probes are distributed as shown below:

The velocities were measured at an equivalent height \(H=15.9m\). The wind directions chosen to be simulated were:
Wind direction |
0.0 \(^\circ\) |
90.0 \(^\circ\) |
180.0 \(^\circ\) |
270.0 \(^\circ\) |
2. Simulation Setup#
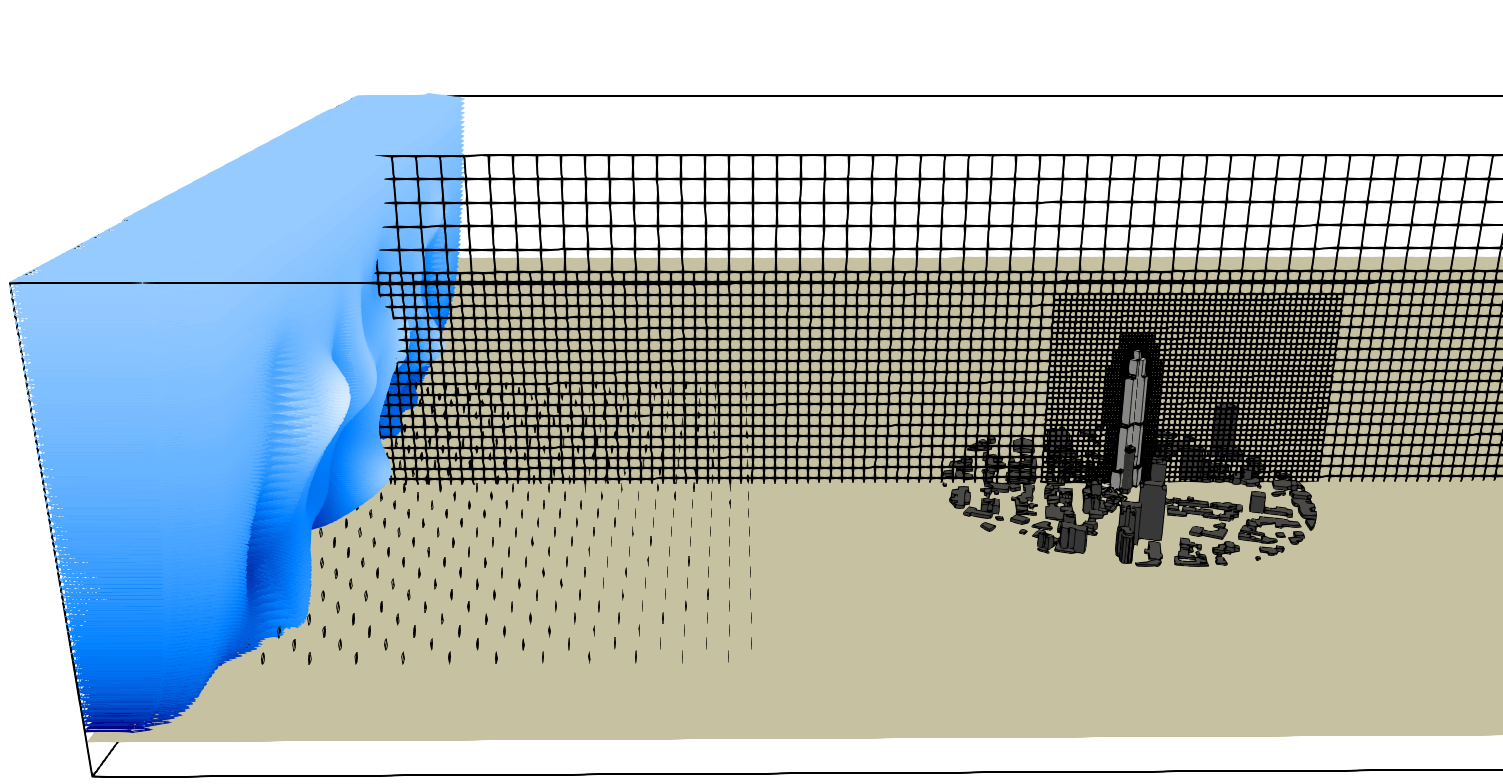
The Synthetic Eddy Method (SEM) boundary condition is applied at the inlet of the computational domain. Solid fins are distributed across the floor to ensure the desired velocity and turbulence profiles during flow development length. A Neumann boundary condition is applied at the remaining boundaries.
The rotative table with equivalent diameter \(D=420m\) was centered \(128H\) from inlet, and 5 grid refinement levels (\(lvl\,0\) to \(lvl\,4\)) were adopted:

A 1:2 refinement ratio is estabilished between levels, and the simulation parameters at grid \(lvl\,4\) were:
\(\boldsymbol{\Delta x/B}\) (spatial resolution) |
4.72e-02 |
\(\boldsymbol{\Delta t/CTS}\) (temporal resolution) |
2.18e-03 |
exports/\(\boldsymbol{CTS}\) (pressure acquisition frequency) |
1.00e+01 |
\(\boldsymbol{T/CTS}\) (statistical sample size) |
1.01e+03 |
\(\boldsymbol{Re_{H}=U_{H}H/\nu}\) |
1.69e+04 |
The equivalent parameters in full scale are:
\(\boldsymbol{\Delta x[m]}\) |
0.75 |
\(\boldsymbol{\Delta t[ms]}\) |
6.41 |
\(\boldsymbol{f[Hz]}\) |
3.40 |
\(\boldsymbol{T[s]}\) |
2973.13 |
The computational resources required were:
Device |
NVIDIA RTX A5500 |
NVIDIA RTX A5500 |
NVIDIA RTX A5500 |
NVIDIA RTX A5500 |
Wind direction |
0.0 \(^\circ\) |
90.0 \(^\circ\) |
180.0 \(^\circ\) |
270.0 \(^\circ\) |
Node count (million) |
26.99 |
26.78 |
26.99 |
26.78 |
Allocated memory (Gb) |
3.48 |
3.44 |
3.48 |
3.44 |
Ellapsed time (h) |
3.82 |
3.67 |
3.83 |
3.62 |
3. Inflow#
An empty domain simulation is performed to measure the incident velocity and turbulence profiles. A probe line is placed at the position where the building will be located. The average velocities used for calculating the pressure coefficient and convective time scale are taken from this simulation.
Wind Profiles#

Wind Spectra#
The power spectral density of the velocity components at height \(H\) are compared with theoretical Von Kármán curves to validate the atmospheric flow.

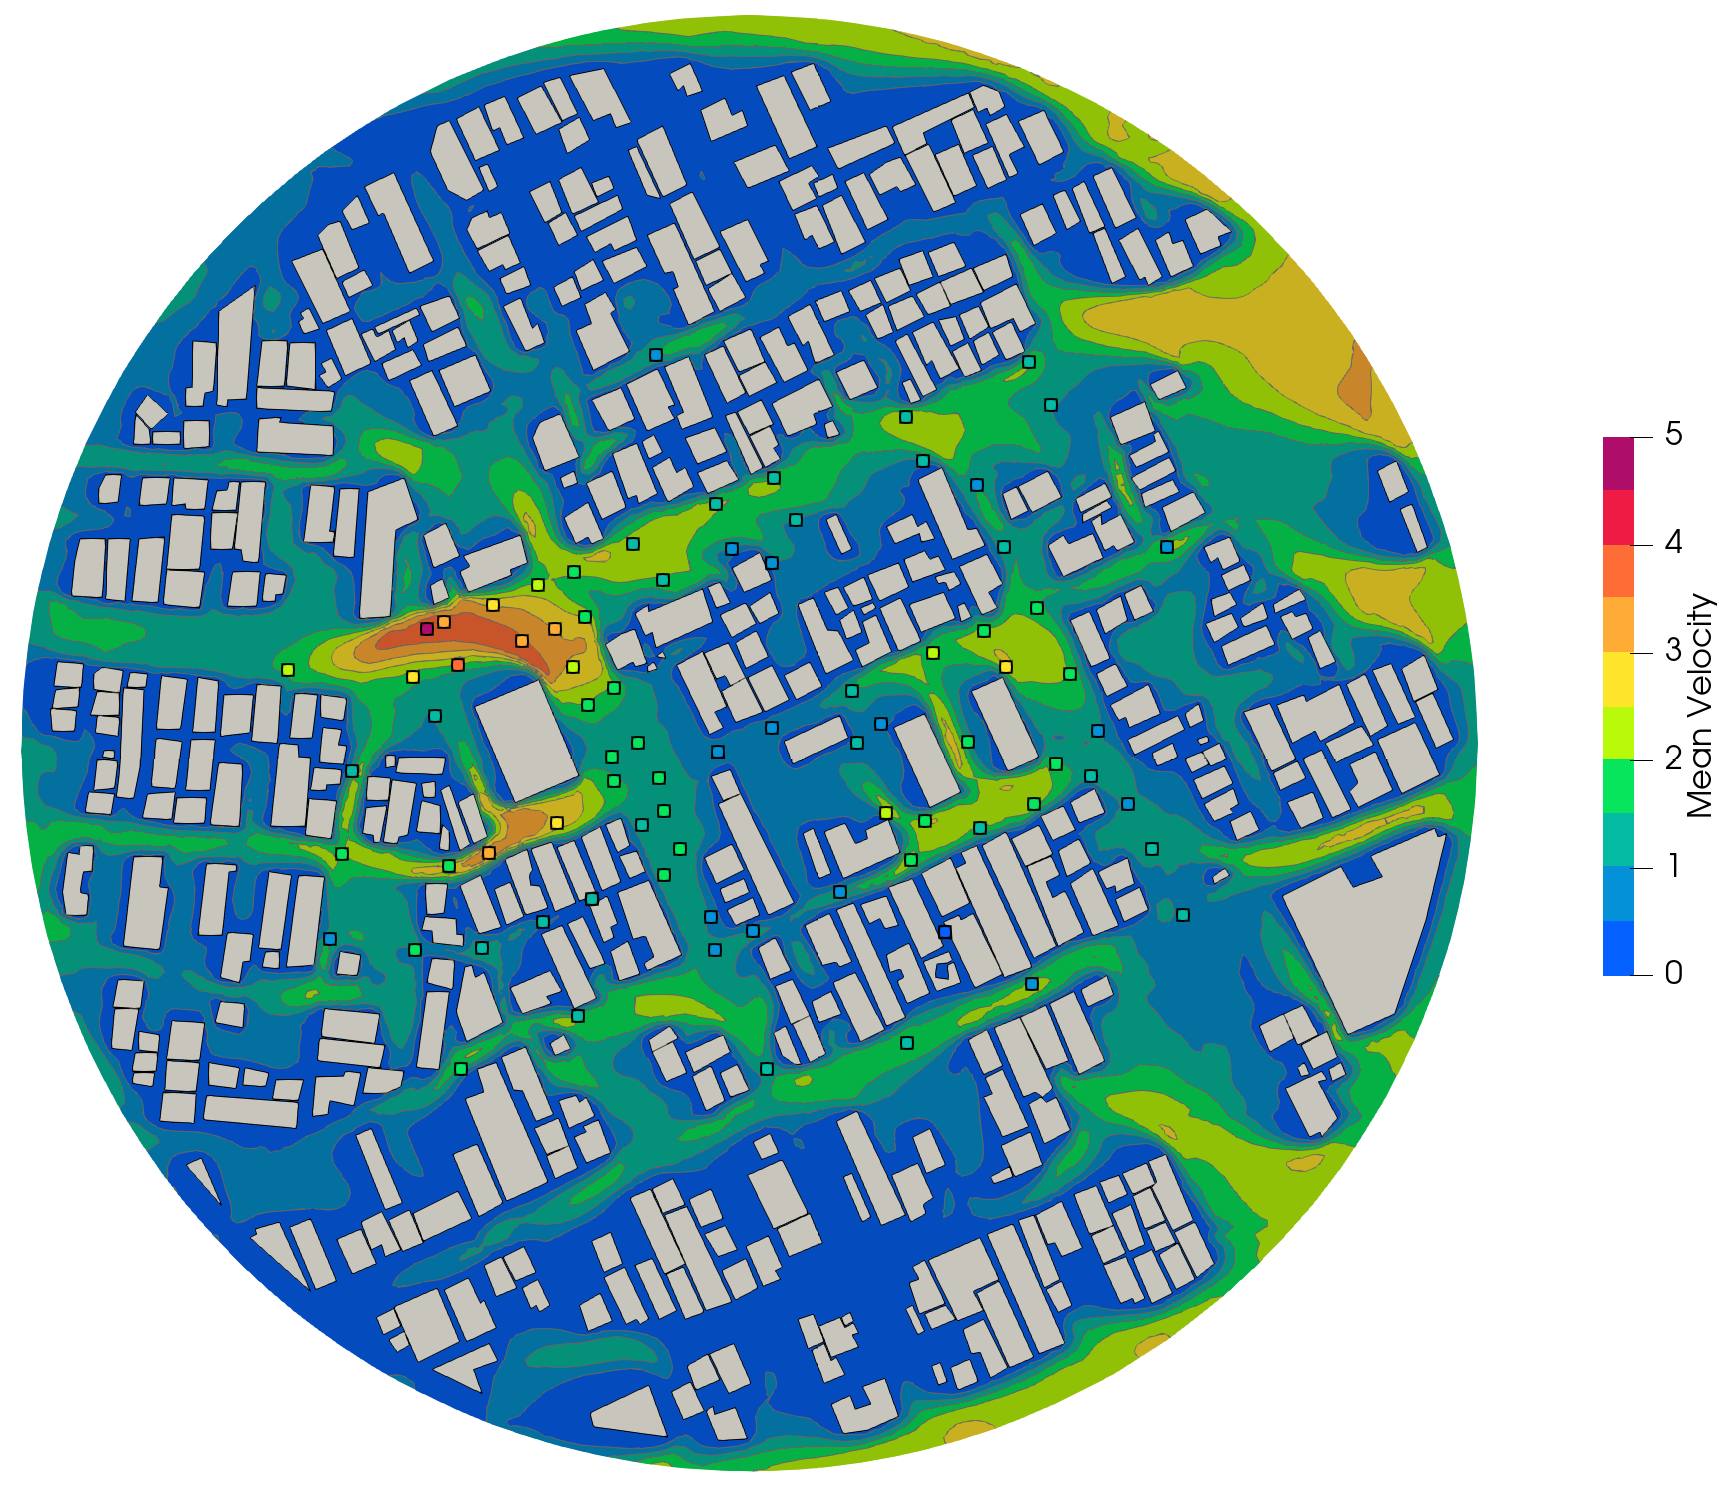
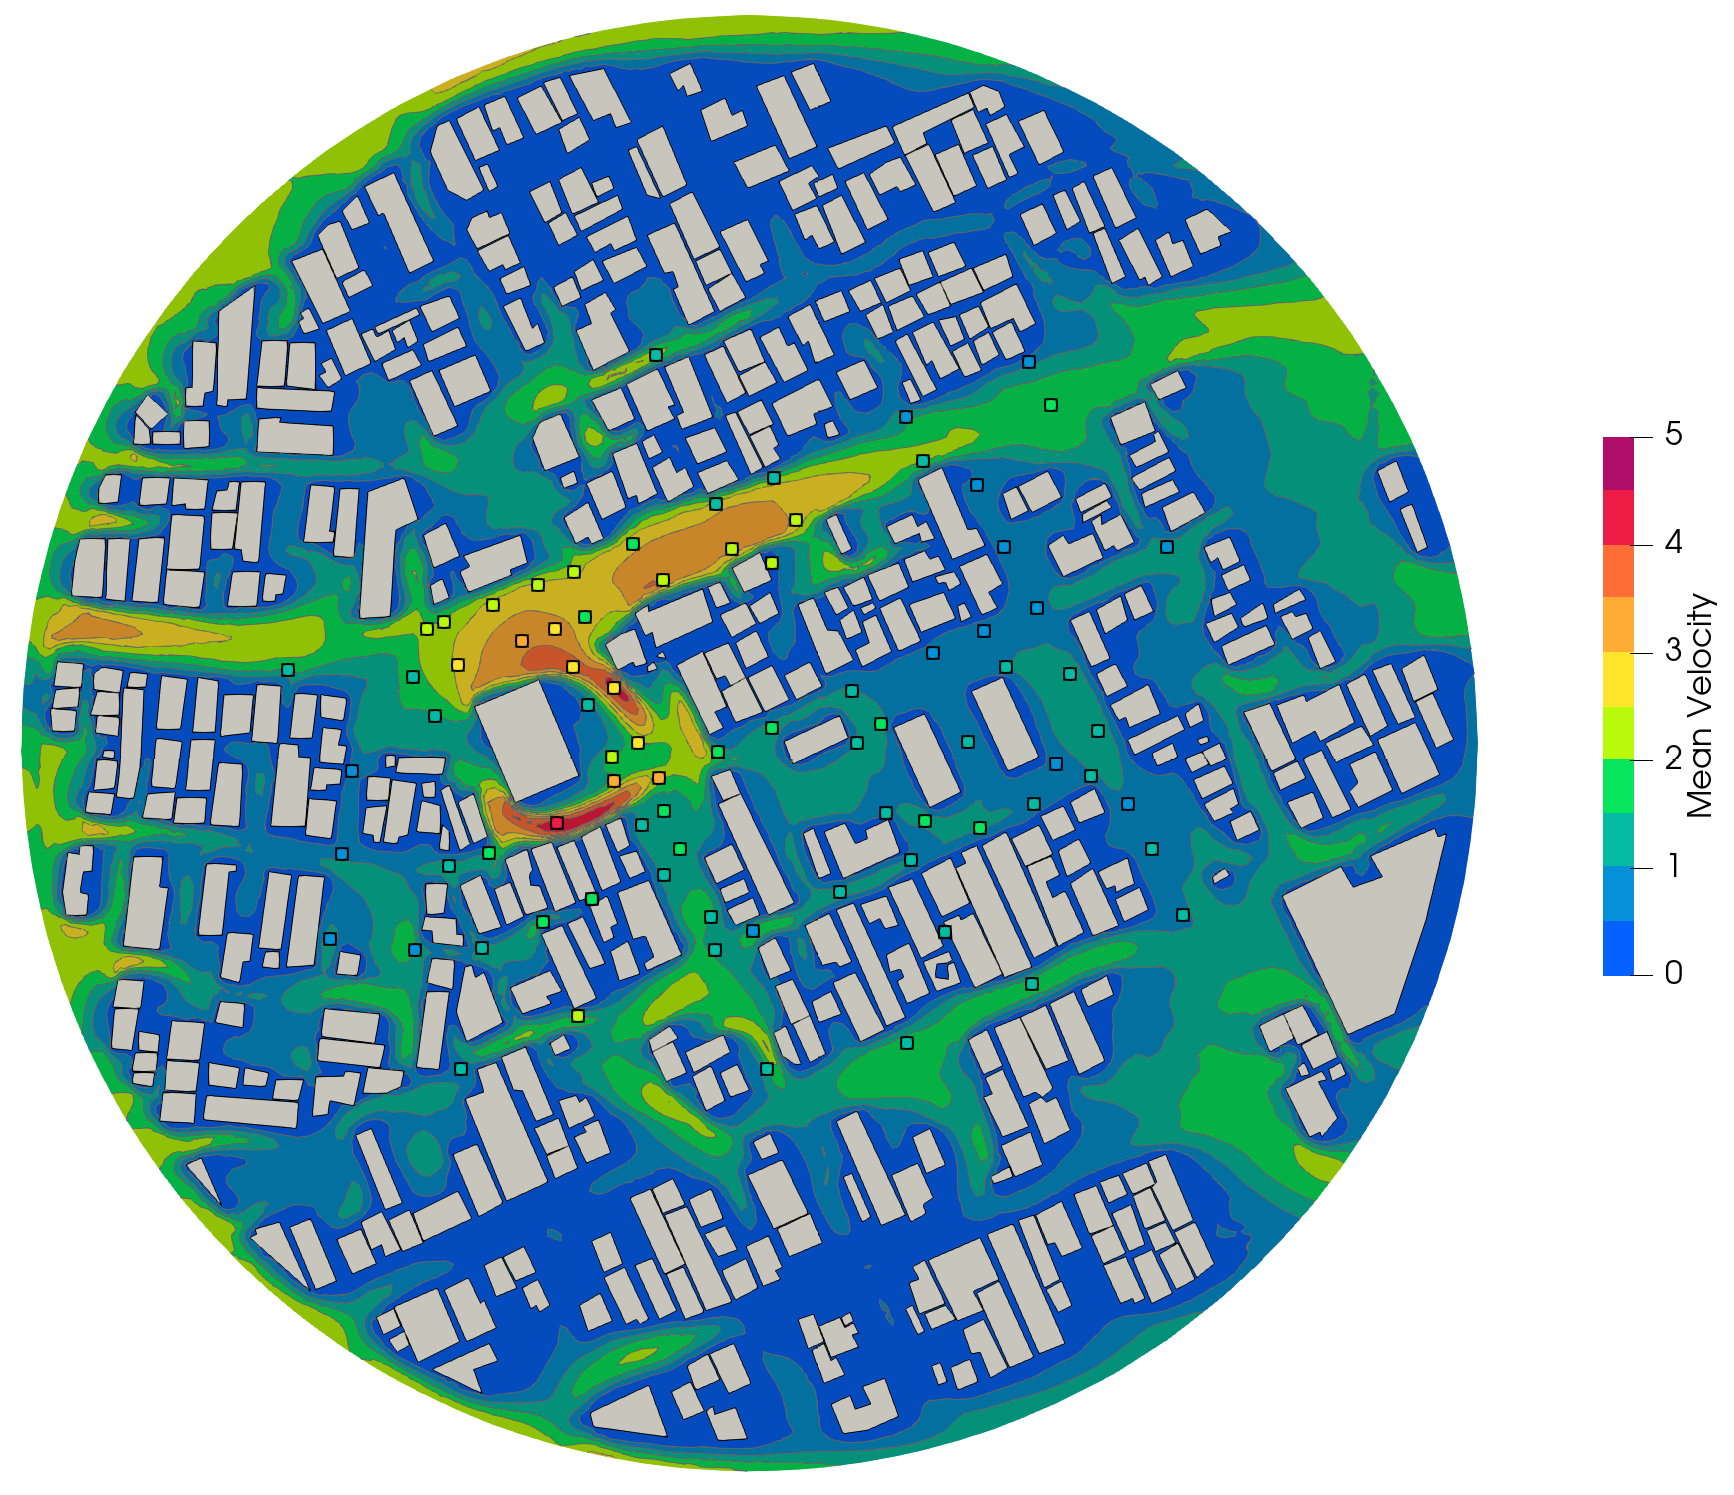
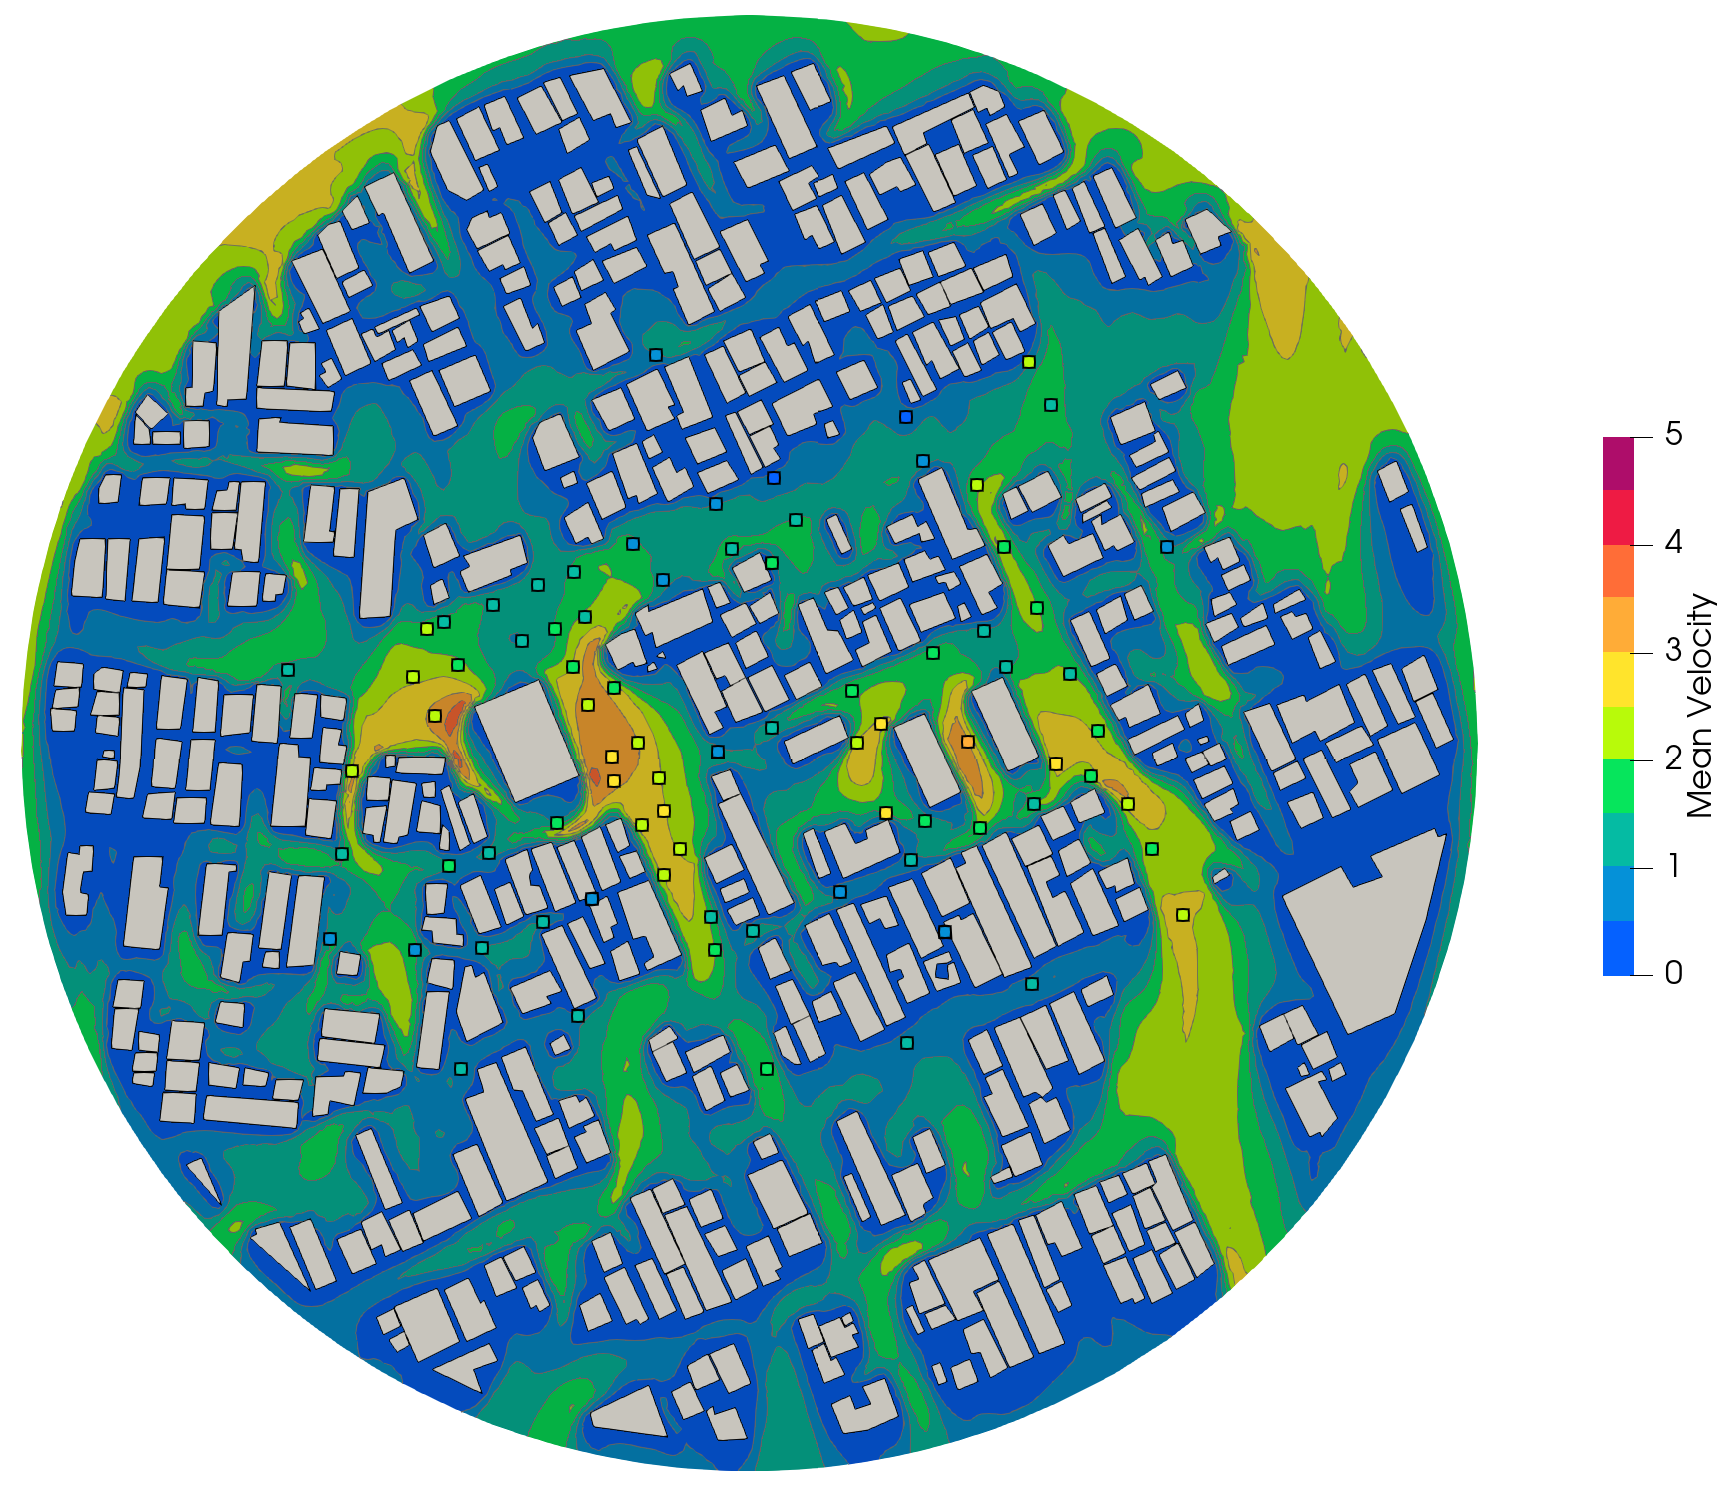
4. Results: Average Velocities#
Probes Statistics#
The average velocity at each probe position is shown below against experimental data.


Velocity Profile#
E:
W:
N:
S:
Execution Notes#
Execution Date (YYYY-MM-DD) |
2025-2-23 |
Solver Version |
1.6.18 |
Changelog#
19 Jan 2025: Added scattering plots